Unlock a world of possibilities! Login now and discover the exclusive benefits awaiting you.
- Qlik Community
- :
- All Forums
- :
- QlikView App Dev
- :
- Re: Gantt chart
- Subscribe to RSS Feed
- Mark Topic as New
- Mark Topic as Read
- Float this Topic for Current User
- Bookmark
- Subscribe
- Mute
- Printer Friendly Page
- Mark as New
- Bookmark
- Subscribe
- Mute
- Subscribe to RSS Feed
- Permalink
- Report Inappropriate Content
Gantt chart
Hi i have bar chart which has to be shown as a gantt chart.
i have one dimension and 6 expressions , which have start date and end date.
so i plotted everything is done.
when i hover on the bars it shows the date as 12/08/1899.
so why its happenning????
for first expression i took floor( start date - enddate).. same thing for the next 5 expressions....
so when ever i hover on the chart it has to show the enddate on the bar .. is that possible..
and also if possible i want to show the enddate for the each expressions..
i tried on show value by using end date .. but still it shows some 1900...
have anyone came across tthis type of issues..
please find the attachedment..
so when u hover on the graph it shows durationa as 1900-1-1-
- Mark as New
- Bookmark
- Subscribe
- Mute
- Subscribe to RSS Feed
- Permalink
- Report Inappropriate Content
You might find the following blog posts quite handy - they worked for me:
http://www.qlikviewaddict.com/2012/06/gantt-charts-in-qlikview.html
http://oneqlikatatime.blogspot.co.uk/2012/07/qlikview-charts-with-colours.html
- Mark as New
- Bookmark
- Subscribe
- Mute
- Subscribe to RSS Feed
- Permalink
- Report Inappropriate Content
plz can anyone reply..
- Mark as New
- Bookmark
- Subscribe
- Mute
- Subscribe to RSS Feed
- Permalink
- Report Inappropriate Content
Hi dude i am not able to get details of chat to be followed in your sample qvw..plz Explain
- Mark as New
- Bookmark
- Subscribe
- Mute
- Subscribe to RSS Feed
- Permalink
- Report Inappropriate Content
This is unfortunately how QlikView works when you use bars with offsets: It shows the number for the bar and not the value of offset+bar. This means that the value will be small and when displayed as date, it corresponds to 1899 or 1900.
You can add an additional number in the pop-up by adding an expression that is not shown as bar - but just as pop-up.
HIC
- Mark as New
- Bookmark
- Subscribe
- Mute
- Subscribe to RSS Feed
- Permalink
- Report Inappropriate Content
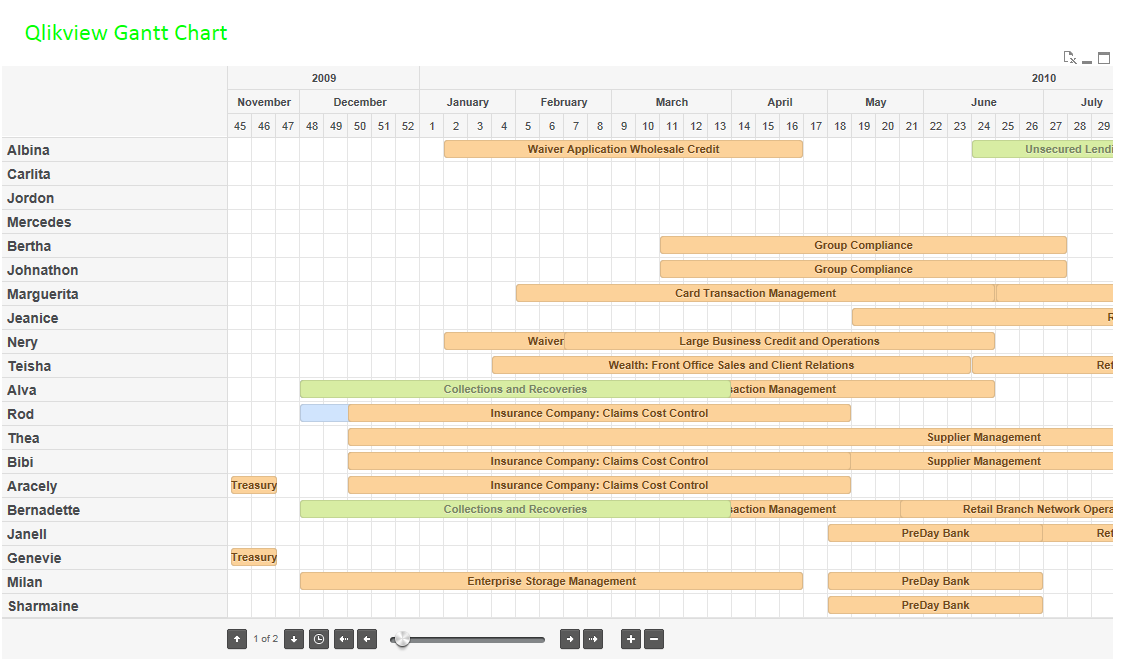
Have you checked out this Gantt chart extension?
http://webofwork.com/index.php/19-qlikview-tips-and-tutorials/90-qlikview-gantt-chart

- Mark as New
- Bookmark
- Subscribe
- Mute
- Subscribe to RSS Feed
- Permalink
- Report Inappropriate Content
file's not available, could you please re-upload?
- Mark as New
- Bookmark
- Subscribe
- Mute
- Subscribe to RSS Feed
- Permalink
- Report Inappropriate Content
bom dia!
consegue nos passar esse .qvw?
att,
André Tonini
Controladoria