Unlock a world of possibilities! Login now and discover the exclusive benefits awaiting you.
- Qlik Community
- :
- All Forums
- :
- QlikView App Dev
- :
- Re: Gauge Chart not showing up
- Subscribe to RSS Feed
- Mark Topic as New
- Mark Topic as Read
- Float this Topic for Current User
- Bookmark
- Subscribe
- Mute
- Printer Friendly Page
- Mark as New
- Bookmark
- Subscribe
- Mute
- Subscribe to RSS Feed
- Permalink
- Report Inappropriate Content
Gauge Chart not showing up
Hi,
I have the below data set. When I load it in my Qlikview script and create a gauge chart. It says bad min or max value.
I have given the Min Value = 0 and Max Value as "Fore casted Booking".
Please see the attachments.
| Year | Actual Bookings | Forecasted Bookings |
| 2014 | 2775 | 4500 |
| 2015 | 22243 | 10000 |
| 2016 | 6320 | 25000 |
Please suggest how to make it so it reflects the value in Gauge chart. Its happening because the value in second and third rows of Forecasted Bookings is high.
Please help
Accepted Solutions
- Mark as New
- Bookmark
- Subscribe
- Mute
- Subscribe to RSS Feed
- Permalink
- Report Inappropriate Content
Try to give like below for your information [Fore casted Booking]
But, My suggestion is this for max? Max([Forecasted Bookings])
- Mark as New
- Bookmark
- Subscribe
- Mute
- Subscribe to RSS Feed
- Permalink
- Report Inappropriate Content
Try to give like below for your information [Fore casted Booking]
But, My suggestion is this for max? Max([Forecasted Bookings])
- Mark as New
- Bookmark
- Subscribe
- Mute
- Subscribe to RSS Feed
- Permalink
- Report Inappropriate Content
Also I want to set a condition that the chart always show me the value for year 2016 and when selection is made in Year Field, it shows the data for that particular field. But if no selection, the data should be shown for 2016
- Mark as New
- Bookmark
- Subscribe
- Mute
- Subscribe to RSS Feed
- Permalink
- Report Inappropriate Content
Could be this?
If(GetFieldSelections(Year) = 1, Max([Forecasted Bookings]), Max({<Year = {'$(=Max(Year))'}>}[Forecasted Bookings]))
- Mark as New
- Bookmark
- Subscribe
- Mute
- Subscribe to RSS Feed
- Permalink
- Report Inappropriate Content
No, its not working
- Mark as New
- Bookmark
- Subscribe
- Mute
- Subscribe to RSS Feed
- Permalink
- Report Inappropriate Content
Can you upload application and explain little more
- Mark as New
- Bookmark
- Subscribe
- Mute
- Subscribe to RSS Feed
- Permalink
- Report Inappropriate Content
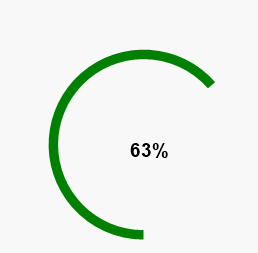
This is the gauge chart. Now it is showing me 63% as the value for the selected year i.e. 2014. This is changing with every selection made in year. My requirement is: When I open my application, it should show the value for 2016 (which is the max year) by default. It must change when a user selects other year.
Is this done by some condition? If yes also please tell where to put the condition.
- Mark as New
- Bookmark
- Subscribe
- Mute
- Subscribe to RSS Feed
- Permalink
- Report Inappropriate Content
Are you talking about Triggers, Would you able to share qvw, Please?
If it is related in triggers you may need to use Max(Year) as search string and Field as Year
- Mark as New
- Bookmark
- Subscribe
- Mute
- Subscribe to RSS Feed
- Permalink
- Report Inappropriate Content
Thanks a lot. I did it with triggers. It worked