Unlock a world of possibilities! Login now and discover the exclusive benefits awaiting you.
- Qlik Community
- :
- All Forums
- :
- QlikView App Dev
- :
- Re: Gauge chart
- Subscribe to RSS Feed
- Mark Topic as New
- Mark Topic as Read
- Float this Topic for Current User
- Bookmark
- Subscribe
- Mute
- Printer Friendly Page
- Mark as New
- Bookmark
- Subscribe
- Mute
- Subscribe to RSS Feed
- Permalink
- Report Inappropriate Content
Gauge chart
Hi all,
I have 2 expressions in my chart .
I need to show it in percentage in scale style.
How to show 2 expressions in single guage chart .
1st expression has 86% and 2nd has 14%
The final scale should have 100%
How to show please help on this
Thanks in advance.
Venkey
- Mark as New
- Bookmark
- Subscribe
- Mute
- Subscribe to RSS Feed
- Permalink
- Report Inappropriate Content
May be use Bound option? Gauge Chart in QlikView – Learn QlikView
- Mark as New
- Bookmark
- Subscribe
- Mute
- Subscribe to RSS Feed
- Permalink
- Report Inappropriate Content
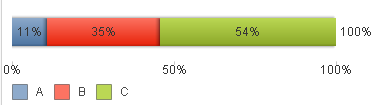
how about using a stacked bar chart with no dimensions, that would look like a linear gauge chart. like below.
- Mark as New
- Bookmark
- Subscribe
- Mute
- Subscribe to RSS Feed
- Permalink
- Report Inappropriate Content
Sure will try
Thanks for your reply.
- Mark as New
- Bookmark
- Subscribe
- Mute
- Subscribe to RSS Feed
- Permalink
- Report Inappropriate Content
Thanks it is working fine.
But scale showing like 0%,20%,40%,60%,80%,100%,120%.
But I need 0%,10%,20%,30%,40%,50%,60%,70%,80%,90%,100% only.
How to make this.
- Mark as New
- Bookmark
- Subscribe
- Mute
- Subscribe to RSS Feed
- Permalink
- Report Inappropriate Content
Use the Static Step setting.
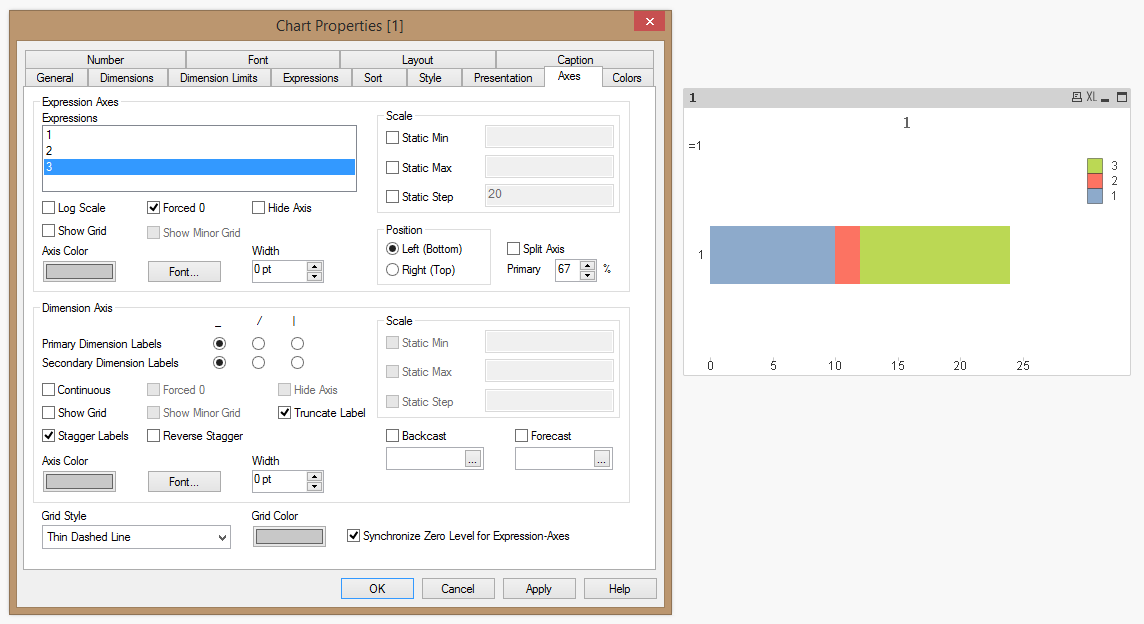
For each expression - set the static step to 10

Rgds,
Benazir