Unlock a world of possibilities! Login now and discover the exclusive benefits awaiting you.
- Qlik Community
- :
- All Forums
- :
- QlikView App Dev
- :
- Gauge with goal and goal over
- Subscribe to RSS Feed
- Mark Topic as New
- Mark Topic as Read
- Float this Topic for Current User
- Bookmark
- Subscribe
- Mute
- Printer Friendly Page
- Mark as New
- Bookmark
- Subscribe
- Mute
- Subscribe to RSS Feed
- Permalink
- Report Inappropriate Content
Gauge with goal and goal over
Dear,I'm starting in Qlikview and I'm trying to create a speedometer graphic, where it displays, when the team is set to the goal, when it is within the goal and when the team exceeds a goal, each with a color in the RGB standard, at where := If (QT_META_REAL <QT_META, RGB (255,0,0), If (QT_META_REAL = QT_META, RGB (0,255,0), If (QT_META_REAL> = QT_EXCENT, RGB The "closer" that got to do is the following in the image.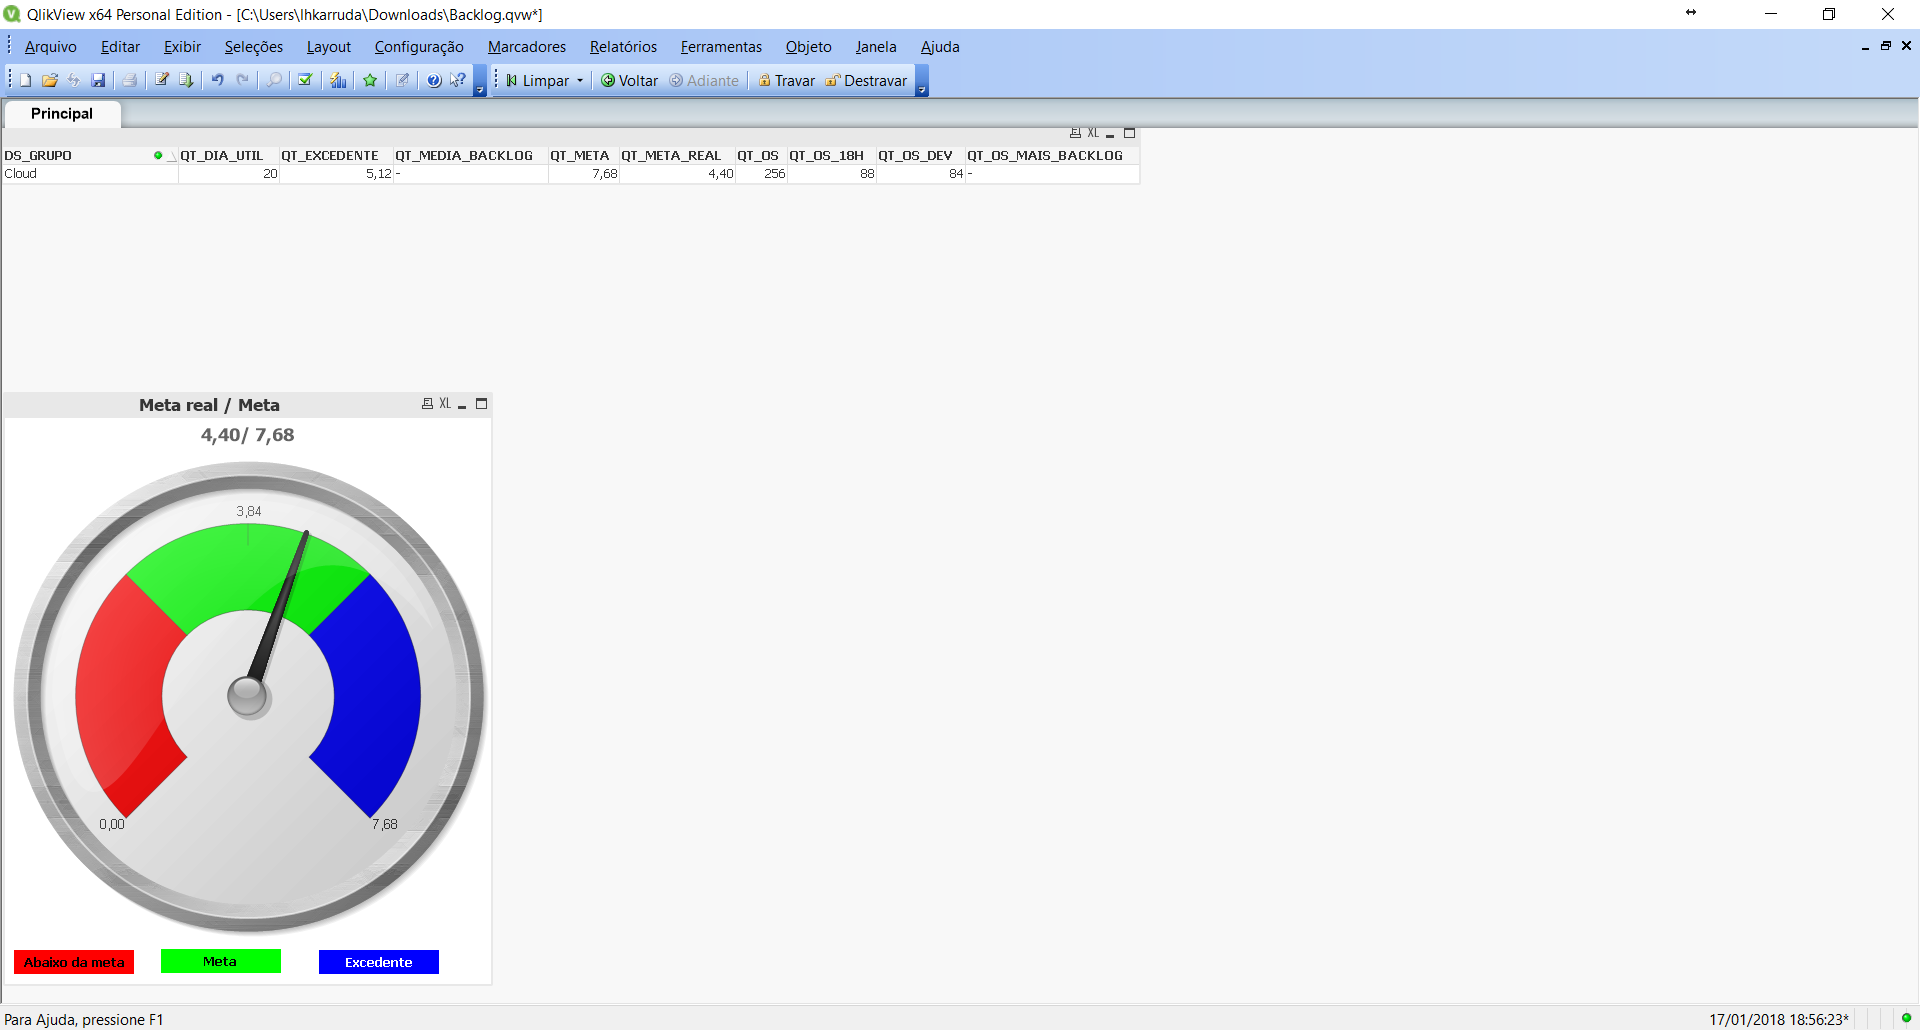
- Mark as New
- Bookmark
- Subscribe
- Mute
- Subscribe to RSS Feed
- Permalink
- Report Inappropriate Content
I have to put some extra information.
My goals are floating and I have the goal exceed, there is 1% less than the goal, so to the group stay in the goal, it need to be between 4 and 3 percent for example, being 4% my goal, and 3% my goal exceed, this values I already have in percentage, they are shown with the "QT_META" for goal, and "QT_EXCEDIDO" for the goal exceed, and I also have the value "QT_META_REAL" that is the actual goal.
So in front of this information I need a gauge that show me when the group is on the goal, is under the goal and when it exceed the goal.
- Mark as New
- Bookmark
- Subscribe
- Mute
- Subscribe to RSS Feed
- Permalink
- Report Inappropriate Content
Welcome to the qlik family..
And, try to full fill the condition. I found 2 backs in ur statement.
1. Rgb() is not filled for last break
2. It shouldn't be space between equal sign and >.