Unlock a world of possibilities! Login now and discover the exclusive benefits awaiting you.
- Qlik Community
- :
- All Forums
- :
- QlikView App Dev
- :
- Re: Get the value of the previous rows loaded
- Subscribe to RSS Feed
- Mark Topic as New
- Mark Topic as Read
- Float this Topic for Current User
- Bookmark
- Subscribe
- Mute
- Printer Friendly Page
- Mark as New
- Bookmark
- Subscribe
- Mute
- Subscribe to RSS Feed
- Permalink
- Report Inappropriate Content
Get the value of the previous rows loaded
Hi,
I have data like this
| Month | Year | Value |
|---|---|---|
| Jan | 2017 | 10 |
| Feb | 2017 | 20 |
| Mar | 2017 | 13 |
| Apr | 2017 | 14 |
| May | 2017 | 12 |
| Jun | 2017 | 23 |
| Jul | 2017 | 45 |
| Aug | 2017 | 676 |
| Sep | 2017 | 78 |
| Oct | 2017 | 65 |
| Nov | 2017 | 55 |
| Dec | 2017 | 77 |
| Jan | 2018 | 88 |
| Feb | 2018 | 44 |
| Mar | 2018 | 33 |
| Apr | 2018 | 21 |
| May | 2018 | 34 |
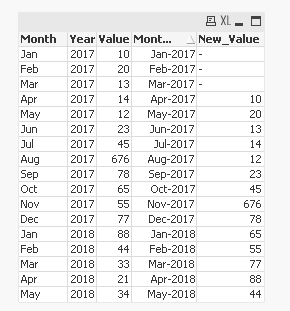
The expected output is like the one below
| Month | Year | Value |
|---|---|---|
| Jan | 2017 | |
| Feb | 2017 | |
| Mar | 2017 | |
| Apr | 2017 | 10 |
| May | 2017 | 20 |
| Jun | 2017 | 13 |
| Jul | 2017 | 14 |
| Aug | 2017 | 12 |
| Sep | 2017 | 23 |
| Oct | 2017 | 45 |
| Nov | 2017 | 676 |
| Dec | 2017 | 78 |
| Jan | 2018 | 65 |
| Feb | 2018 | 55 |
| Mar | 2018 | 77 |
| Apr | 2018 | 88 |
| May | 2018 | 44 |
I want the value of Feb 2018 in May 2018 month, Jan 2018 value in Apr 2018 month, Dec 2017 Value in Mar 2018 and so on.
How can we achieve this functionality in QlikView?
- Mark as New
- Bookmark
- Subscribe
- Mute
- Subscribe to RSS Feed
- Permalink
- Report Inappropriate Content
This?
Table:
LOAD *,
Date(MonthStart(Date#(Month&'-'&Year, 'MMM-YYYY')), 'MMM-YYYY') as MonthYear;
LOAD * INLINE [
Month, Year, Value
Jan, 2017, 10
Feb, 2017, 20
Mar, 2017, 13
Apr, 2017, 14
May, 2017, 12
Jun, 2017, 23
Jul, 2017, 45
Aug, 2017, 676
Sep, 2017, 78
Oct, 2017, 65
Nov, 2017, 55
Dec, 2017, 77
Jan, 2018, 88
Feb, 2018, 44
Mar, 2018, 33
Apr, 2018, 21
May, 2018, 34
];
FinalTable:
LOAD *,
If(RowNo() > 3, Peek('Value', -3)) as New_Value
Resident Table
Order By MonthYear;
DROP Table Table;
- Mark as New
- Bookmark
- Subscribe
- Mute
- Subscribe to RSS Feed
- Permalink
- Report Inappropriate Content
Thanks for the reply Sunny.
What if we have multiple fields in our data and we have multiple entries for a single month. The above logic works only if we have single entry for a month and year.
So the Month Jan and Year 2018 repeats multiple times in a single table because of the combination of other fields in the table. Then i think we cannot use Peek this way.
- Mark as New
- Bookmark
- Subscribe
- Mute
- Subscribe to RSS Feed
- Permalink
- Report Inappropriate Content
It might help to see what you might have... I am not sure we can solve if I keep on guessing what you might have 
- Mark as New
- Bookmark
- Subscribe
- Mute
- Subscribe to RSS Feed
- Permalink
- Report Inappropriate Content
Hi Sunny,
PFA the sample data for the same.
Thanks.
- Mark as New
- Bookmark
- Subscribe
- Mute
- Subscribe to RSS Feed
- Permalink
- Report Inappropriate Content
And how would you like to see the new_value column? after loading this into your dashboard?
- Mark as New
- Bookmark
- Subscribe
- Mute
- Subscribe to RSS Feed
- Permalink
- Report Inappropriate Content
I would like to see it as
Jan 2017, Feb 2017, Mar 2017,.... May 2018 will all have individual sum value.
But these months sum value should filter the data in front end based on other field selections in the table.
Like when we filter something from Hierarchy2 field, then the sum value for months should change based on the selection. If we filter on Hierarchy3 field, then the sum value for the months should change on fly.
- Mark as New
- Bookmark
- Subscribe
- Mute
- Subscribe to RSS Feed
- Permalink
- Report Inappropriate Content
From what you are saying it might make sense to implement The As-Of Table