Unlock a world of possibilities! Login now and discover the exclusive benefits awaiting you.
- Qlik Community
- :
- All Forums
- :
- QlikView App Dev
- :
- Going back in time - need help in Set Analysis, ex...
- Subscribe to RSS Feed
- Mark Topic as New
- Mark Topic as Read
- Float this Topic for Current User
- Bookmark
- Subscribe
- Mute
- Printer Friendly Page
- Mark as New
- Bookmark
- Subscribe
- Mute
- Subscribe to RSS Feed
- Permalink
- Report Inappropriate Content
Going back in time - need help in Set Analysis, expression building
I have a situation where I need to build an expression based on previous months or previous years data based on what the user has selected. For this example I need to go back 1 month. The date is not a dimension in the straight table.
sum( {{< %DIM_DATE_KEY= P({1<%DIM_DATE_KEY={"$(=Date(AddMonths(max(%DIM_DATE_KEY),-1)),'MM/DD/YYYY')"} >} %DIM_DATE_KEY) >} CALL_COUNT)
Right now I have this expression showing as follows in the straight table - notice the data for the previous period is blank when I select september 01, 2017:
I have data for August as seen in the attachment.
Accepted Solutions
- Mark as New
- Bookmark
- Subscribe
- Mute
- Subscribe to RSS Feed
- Permalink
- Report Inappropriate Content
I'm trying to apply this to a sum where I'm looking at the previous period from what's being selected:
I put your expression in my sum, trying to get this to work, but it's still showing '0' 's in my straight table.
The date range is now looking the way I want it.
sum( {{< %DIM_DATE_KEY= P({1< %DIM_DATE_KEY={">=$(=Date(AddMonths(Min(%DIM_DATE_KEY),-1),'MM/DD/YYYY'))<=$(=Date(AddMonths(Max(%DIM_DATE_KEY),-1),'MM/DD/YYYY'))"} >} %DIM_DATE_KEY) >} CALL_COUNT)
- Mark as New
- Bookmark
- Subscribe
- Mute
- Subscribe to RSS Feed
- Permalink
- Report Inappropriate Content
Looks like the dollar sign expansion shows a syntax error:
Try
{'$(=Date(AddMonths(max(%DIM_DATE_KEY),-1),'MM/DD/YYYY'))'}
- Mark as New
- Bookmark
- Subscribe
- Mute
- Subscribe to RSS Feed
- Permalink
- Report Inappropriate Content
Stefan:
maybe to simplify it, if I can show in a list box , the prior months periods of what's been selected, that's what I'm looking for.
As you can see here, it's taking the max
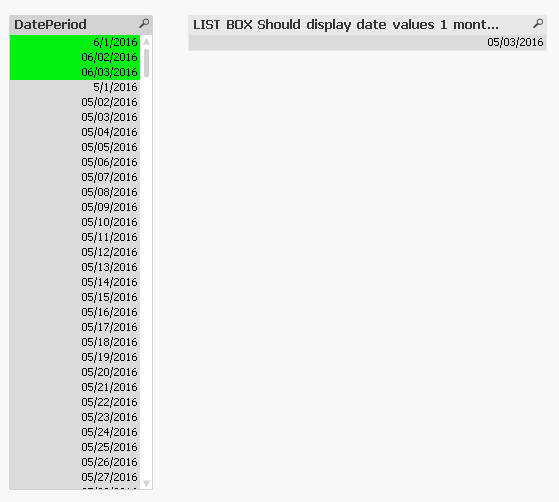 !
!
See attachments and image.
Gerry.
- Mark as New
- Bookmark
- Subscribe
- Mute
- Subscribe to RSS Feed
- Permalink
- Report Inappropriate Content
If you select a continuous range, you can use a numeric search:
=aggr(only({<DatePeriod=P({1< DatePeriod={">=$(=Date(AddMonths(Min(DatePeriod),-1),'MM/DD/YYYY'))<=$(=Date(AddMonths(Max(DatePeriod),-1),'MM/DD/YYYY'))"} >} ) >} DatePeriod), DatePeriod)
- Mark as New
- Bookmark
- Subscribe
- Mute
- Subscribe to RSS Feed
- Permalink
- Report Inappropriate Content
I am not 100% sure what you want to achieve, but I think you don't need the p() function here:
=aggr(only({<DatePeriod={">=$(=Date(AddMonths(Min(DatePeriod),-1),'MM/DD/YYYY'))<=$(=Date(AddMonths(Max(DatePeriod),-1),'MM/DD/YYYY'))"} >} DatePeriod), DatePeriod)
- Mark as New
- Bookmark
- Subscribe
- Mute
- Subscribe to RSS Feed
- Permalink
- Report Inappropriate Content
I'm trying to apply this to a sum where I'm looking at the previous period from what's being selected:
I put your expression in my sum, trying to get this to work, but it's still showing '0' 's in my straight table.
The date range is now looking the way I want it.
sum( {{< %DIM_DATE_KEY= P({1< %DIM_DATE_KEY={">=$(=Date(AddMonths(Min(%DIM_DATE_KEY),-1),'MM/DD/YYYY'))<=$(=Date(AddMonths(Max(%DIM_DATE_KEY),-1),'MM/DD/YYYY'))"} >} %DIM_DATE_KEY) >} CALL_COUNT)
- Mark as New
- Bookmark
- Subscribe
- Mute
- Subscribe to RSS Feed
- Permalink
- Report Inappropriate Content
Guess you don't make your selections in the date key?
Then you may need to clear all user selections that may interfere with your set modifier in the set analysis (or use set identifier 1 in your main set expression).
Have a look at
https://aftersync.com/blog/the-magic-of-set-analysis-point-in-time-reporting
- Mark as New
- Bookmark
- Subscribe
- Mute
- Subscribe to RSS Feed
- Permalink
- Report Inappropriate Content
Stefan:
I will be making date selections in the datekey.
Gerry.
- Mark as New
- Bookmark
- Subscribe
- Mute
- Subscribe to RSS Feed
- Permalink
- Report Inappropriate Content
Then please update your sample application with the chart & expression in question.