Unlock a world of possibilities! Login now and discover the exclusive benefits awaiting you.
- Qlik Community
- :
- All Forums
- :
- QlikView App Dev
- :
- Re: Graph Grouped Issue
- Subscribe to RSS Feed
- Mark Topic as New
- Mark Topic as Read
- Float this Topic for Current User
- Bookmark
- Subscribe
- Mute
- Printer Friendly Page
- Mark as New
- Bookmark
- Subscribe
- Mute
- Subscribe to RSS Feed
- Permalink
- Report Inappropriate Content
Graph Grouped Issue
Hello,
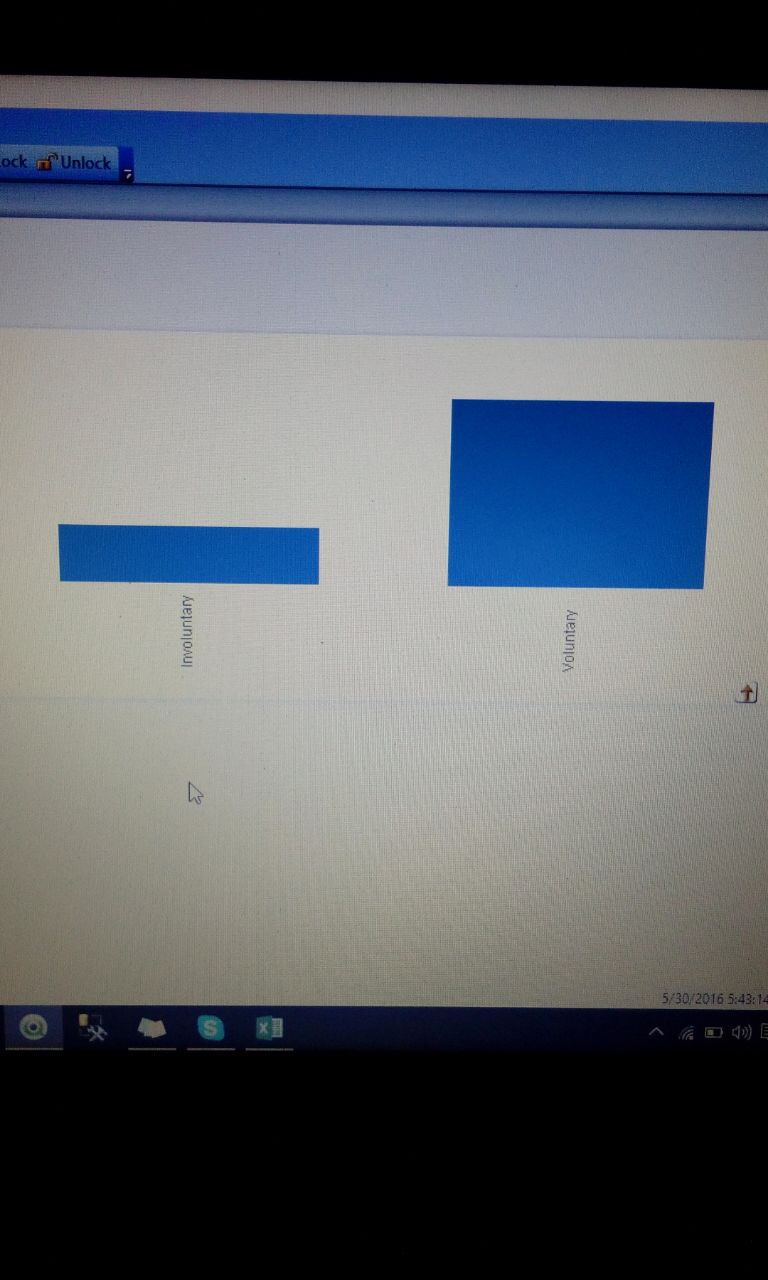
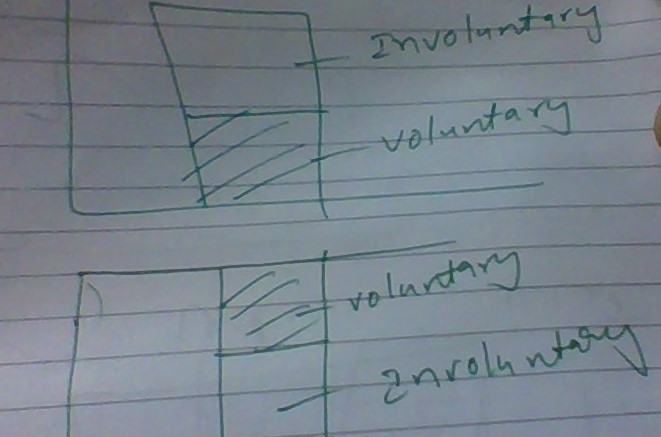
I have 1 Normal Graph. PFA
I attached 2 Graph's ..
1) Normal 2) Expected
- « Previous Replies
- Next Replies »
- Mark as New
- Bookmark
- Subscribe
- Mute
- Subscribe to RSS Feed
- Permalink
- Report Inappropriate Content
You need a stacked chart style.
Qlik Community Tip: Posting Successful Discussion Threads
- Mark as New
- Bookmark
- Subscribe
- Mute
- Subscribe to RSS Feed
- Permalink
- Report Inappropriate Content
I have one graph which name is Normal (PFA)
My output required which i attached the Expected (PFA)
- Mark as New
- Bookmark
- Subscribe
- Mute
- Subscribe to RSS Feed
- Permalink
- Report Inappropriate Content
Hi,
In order to make Stacked Bar chart, you will need to add at lease two expressions..
that means you may have to make some changes in your data model.. i.e you have to make Voluntary and Non Voluntary as your column, currently they are the values of some other column..hope that make sense..
Attaching a sample QVW for you to review..
-Kamal
- Mark as New
- Bookmark
- Subscribe
- Mute
- Subscribe to RSS Feed
- Permalink
- Report Inappropriate Content
Kamal,
PFA of Sample..
First i want to show Year like 2014, 2015 and 2016
When i click on 2014 i want to show like Expected o/p (for reference Before attachment)...
Same as 2015, 2016
- Mark as New
- Bookmark
- Subscribe
- Mute
- Subscribe to RSS Feed
- Permalink
- Report Inappropriate Content
Hi Kamal,
Seems like you want to use both stacked and grouped bar charts, which I do not think is possible.
- Mark as New
- Bookmark
- Subscribe
- Mute
- Subscribe to RSS Feed
- Permalink
- Report Inappropriate Content
Hey there,
I guess what you require isn't possible with only one dimession in your chart. For a chart to be grouped or stacked you'll need more than one dimension and you have only one. Sorry mate 
Regards,
MB
- Mark as New
- Bookmark
- Subscribe
- Mute
- Subscribe to RSS Feed
- Permalink
- Report Inappropriate Content
Miguel,
Give me one example for that with 2 Dimensions. Please work on my qvw only.
And then try how it came. So that, i can use main task ...
- Mark as New
- Bookmark
- Subscribe
- Mute
- Subscribe to RSS Feed
- Permalink
- Report Inappropriate Content
See this example using your qvw please 
Regards,
MB
- Mark as New
- Bookmark
- Subscribe
- Mute
- Subscribe to RSS Feed
- Permalink
- Report Inappropriate Content
Miguel,
That i already applied. So finally what i would like to ask you one more question here.
Is this possible to rotate this graph. Above graph is Original - Now here i want to use Butterfly Graph. So, i want to change first graph to second graph ...
Like Mirror .. Please find Attachment ...!
- « Previous Replies
- Next Replies »