Unlock a world of possibilities! Login now and discover the exclusive benefits awaiting you.
- Qlik Community
- :
- All Forums
- :
- QlikView App Dev
- :
- Re: Graph help
- Subscribe to RSS Feed
- Mark Topic as New
- Mark Topic as Read
- Float this Topic for Current User
- Bookmark
- Subscribe
- Mute
- Printer Friendly Page
- Mark as New
- Bookmark
- Subscribe
- Mute
- Subscribe to RSS Feed
- Permalink
- Report Inappropriate Content
Graph help
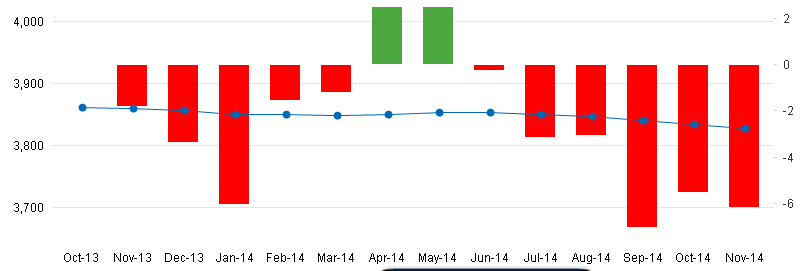
I am looking for some help on the following graph:

I am using the following two formulas:
Bars -
(Sum({<MONTHYEAR ={">=$(=Date(addmonths(Max(MONTHYEAR), -14), 'MMM-YY')) <=$(=Date(addmonths(Max(MONTHYEAR), -1), 'MMM-YY'))"} , [NEW RENEW IND]={'COMBINED'}>} EIF) -
ABOVE(Sum({<MONTHYEAR ={">=$(=Date(addmonths(Max(MONTHYEAR), -14), 'MMM-YY')) <=$(=Date(addmonths(Max(MONTHYEAR), -1), 'MMM-YY'))"} , [NEW RENEW IND]={'COMBINED'}>} EIF)))
/1000
Line with dots -
Sum({<MONTHYEAR ={">=$(=Date(addmonths(Max(MONTHYEAR), -14), 'MMM-YY')) <=$(=Date(addmonths(Max(MONTHYEAR), -1), 'MMM-YY'))"} , [NEW RENEW IND]={'COMBINED'}>} EIF)/1000
I am trying to hide the dot for Oct-13, but show the bars as is currently displayed. When I try to change the line formula to -13, it causes an error with the access. Looking for some help to have the proper functionality.
Thank you,
Justin
- Tags:
- charts
- « Previous Replies
-
- 1
- 2
- Next Replies »
- Mark as New
- Bookmark
- Subscribe
- Mute
- Subscribe to RSS Feed
- Permalink
- Report Inappropriate Content
Can you post sample .qvw with data.
- Mark as New
- Bookmark
- Subscribe
- Mute
- Subscribe to RSS Feed
- Permalink
- Report Inappropriate Content
Here is the attached QVW
- Mark as New
- Bookmark
- Subscribe
- Mute
- Subscribe to RSS Feed
- Permalink
- Report Inappropriate Content
Hi Justin,
I tried to change the line formula to -13 and the requirement is met.Its not causing any error for me. Attached the screenshot as well as qvw for reference.

Regards
- Mark as New
- Bookmark
- Subscribe
- Mute
- Subscribe to RSS Feed
- Permalink
- Report Inappropriate Content
try,suppress null values on bar chart exp/dimension
- Mark as New
- Bookmark
- Subscribe
- Mute
- Subscribe to RSS Feed
- Permalink
- Report Inappropriate Content
same I tried and it is working fine
- Mark as New
- Bookmark
- Subscribe
- Mute
- Subscribe to RSS Feed
- Permalink
- Report Inappropriate Content
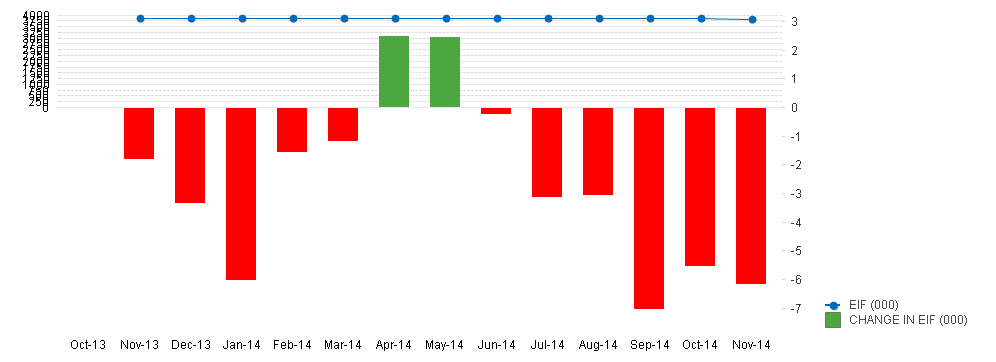
When I try the graph, here is the picture I get:

- Mark as New
- Bookmark
- Subscribe
- Mute
- Subscribe to RSS Feed
- Permalink
- Report Inappropriate Content
Shiva,
I tried to suppress the value and that did not alter the graph.
Rakesh and HareKrishna, what settings are you using to cause the normal graph, I have tried everything I can think of, and continue to get the result above. Also, did you change anything else in the expression?
- Mark as New
- Bookmark
- Subscribe
- Mute
- Subscribe to RSS Feed
- Permalink
- Report Inappropriate Content
The only change I made is -13 . Using exactly the same expression for Line:
Sum({<MONTHYEAR ={">=$(=Date(addmonths(Max(MONTHYEAR), -13), 'MMM-YY')) <=$(=Date(addmonths(Max(MONTHYEAR), -1), 'MMM-YY'))"} , [NEW RENEW IND]={'COMBINED'}>} EIF)/1000
What do you mean by settings here?
- Mark as New
- Bookmark
- Subscribe
- Mute
- Subscribe to RSS Feed
- Permalink
- Report Inappropriate Content
Just trying to figure out how yours shows
- « Previous Replies
-
- 1
- 2
- Next Replies »