Unlock a world of possibilities! Login now and discover the exclusive benefits awaiting you.
- Qlik Community
- :
- All Forums
- :
- QlikView App Dev
- :
- Re: Grouping by a calculated dimension by month
- Subscribe to RSS Feed
- Mark Topic as New
- Mark Topic as Read
- Float this Topic for Current User
- Bookmark
- Subscribe
- Mute
- Printer Friendly Page
- Mark as New
- Bookmark
- Subscribe
- Mute
- Subscribe to RSS Feed
- Permalink
- Report Inappropriate Content
Grouping by a calculated dimension by month
Good afternoon,
I have data that has information by customers per month. Within the data I have how many products the customer has and what are the balances for those products. What I need to do is group by month my customers and add all the balances for all the different products he/she may have and group then by tiers.
For example, I have the following data:
| Date | Customer | Customer Number | Account | Product | Balance |
| 01/01/2014 | John Doe | XXXX1 | 1234 | Tran | $ 1,000 |
| 01/01/2014 | John Doe | XXXX1 | 4567 | Time | $ 3,000 |
| 01/01/2014 | Jane Smith | XXXX2 | 8910 | Tran | $ 5,000 |
| 01/01/2014 | Jane Smith | XXXX2 | 2345 | Time | $ 6,000 |
| 02/01/2014 | John Doe | XXXX1 | 1234 | Tran | $ 1,000 |
| 02/01/2014 | John Doe | XXXX1 | 4567 | Time | $ 2,000 |
| 02/01/2014 | Jane Smith | XXXX2 | 8910 | Tran | $ 5,000 |
| 02/01/2014 | Jane Smith | XXXX2 | 2345 | Time | $ 50 |
| 03/01/2014 | John Doe | XXXX1 | 1234 | Tran | $ 5,000 |
| 03/01/2014 | John Doe | XXXX1 | 4567 | Time | $ 11,000 |
| 03/01/2014 | Jane Smith | XXXX2 | 8910 | Tran | $ 10,000 |
| 03/01/2014 | Jane Smith | XXXX2 | 2345 | Time | $ 12,000 |
My Tiers are:
| Tier 1 | <$1000 |
| Tier 2 | $1000 to <$5000 |
| Tier 3 | $5000 to <$10,000 |
| Tier 4 | $10,000 + |
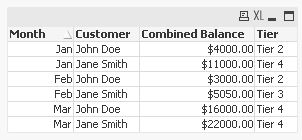
My data should be grouped like this:
| Month | Customer Name | Combined Balance | Tier |
| January | John Doe | $ 4,000 | Tier 2 |
| Jane Doe | $ 11,000 | Tier 4 | |
| February | John Doe | $ 3,000 | Tier 2 |
| Jane Doe | $ 5,050 | Tier 3 | |
| March | John Doe | $ 16,000 | Tier 4 |
| Jane Doe | $ 22,000 | Tier 4 |
And in the front end I want to create a table with the Tiers as my dimension where the numbers would change according to the month I have selected. For example:
If January is selected, I want the table to show:
| January | ||
| Tiers | Number of Customers | Balance |
| <$1000 | 0 | $ - |
| $1000 to <$5000 | 1 | $ 4,000 |
| $5000 to <$10,000 | 0 | $ - |
| $10,000 + | 1 | $ 11,000 |
If February:
| February | ||
| <$1000 | 0 | $ - |
| $1000 to <$5000 | 1 | $ 3,000 |
| $5000 to <$10,000 | 1 | $ 5,050 |
| $10,000 + | 0 | $ - |
and If March is selected:
| March | ||
| <$1000 | 0 | $ - |
| $1000 to <$5000 | 0 | $ - |
| $5000 to <$10,000 | 0 | $ - |
| $10,000 + | 2 | $ 38,000 |
Before I had this within my script, but when I created a master calendar, the month was no longer coming from the same resident table. Since I eliminated the month from the same table, the problem I am having now is that my addition of the balances is not filtering by month, so it is adding all my data together, therefore not giving me the correct breakdown per month.
- Tags:
- new_to_qlikview
- Mark as New
- Bookmark
- Subscribe
- Mute
- Subscribe to RSS Feed
- Permalink
- Report Inappropriate Content
Hi,
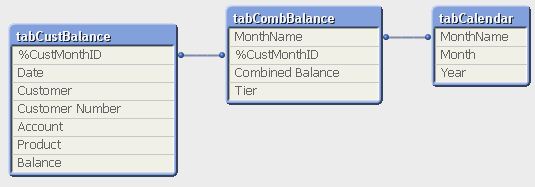
one solution could be:


tabCustBalance:
LOAD *,
    AutoNumberHash128([Customer Number],MonthName(Date)) as %CustMonthID
FROM [http://community.qlik.com/thread/143395] (html, codepage is 1252, embedded labels, table is @1);

tabCombBalance:
LOAD *,
    If([Combined Balance]<1000, 'Tier 1',
      If([Combined Balance]>=1000 and [Combined Balance]<5000, 'Tier 2',
      If([Combined Balance]>=5000 and [Combined Balance]<10000, 'Tier 3',
        If([Combined Balance]>10000, 'Tier 4')))) as Tier;
LOAD %CustMonthID,
    Money(Sum(Balance)) as [Combined Balance],
    MonthName(Date) as MonthName
Resident tabCustBalance
Group By %CustMonthID,MonthName(Date);

tabCalendar:
LOAD MonthName,
    Month(MonthName) as Month,
    Year(MonthName) as Year;
LOAD MonthName(AddMonths(MinMonth,IterNo()-1)) as MonthName
While AddMonths(MinMonth,IterNo()-1)<=MaxMonth;
LOAD MonthName(Min(Date)) as MinMonth,
    MonthName(Max(Date)) as MaxMonth
Resident tabCustBalance;
hope this helps
regards
Marco