Unlock a world of possibilities! Login now and discover the exclusive benefits awaiting you.
- Qlik Community
- :
- All Forums
- :
- QlikView App Dev
- :
- Re: Grouping
- Subscribe to RSS Feed
- Mark Topic as New
- Mark Topic as Read
- Float this Topic for Current User
- Bookmark
- Subscribe
- Mute
- Printer Friendly Page
- Mark as New
- Bookmark
- Subscribe
- Mute
- Subscribe to RSS Feed
- Permalink
- Report Inappropriate Content
Grouping
Hi,
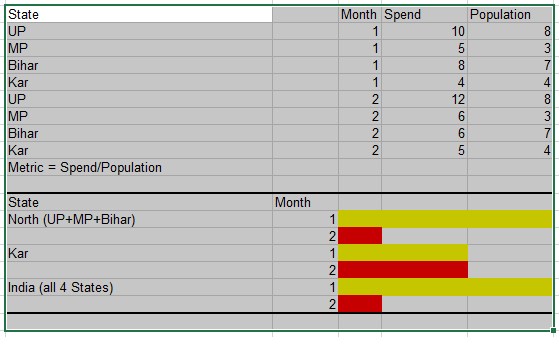
I have a situation where in I need to group the values of one column and project the metric for the total as well in chart(not in table)
| State | Spend | Population | |
| UP | 10 | 8 | |
| MP | 5 | 3 | |
| Bihar | 8 | 7 | |
| Kar | 4 | 4 | |
Accepted Solutions
- Mark as New
- Bookmark
- Subscribe
- Mute
- Subscribe to RSS Feed
- Permalink
- Report Inappropriate Content
- Mark as New
- Bookmark
- Subscribe
- Mute
- Subscribe to RSS Feed
- Permalink
- Report Inappropriate Content
Would you be able to share your Excel file as a file instead of image?
- Mark as New
- Bookmark
- Subscribe
- Mute
- Subscribe to RSS Feed
- Permalink
- Report Inappropriate Content
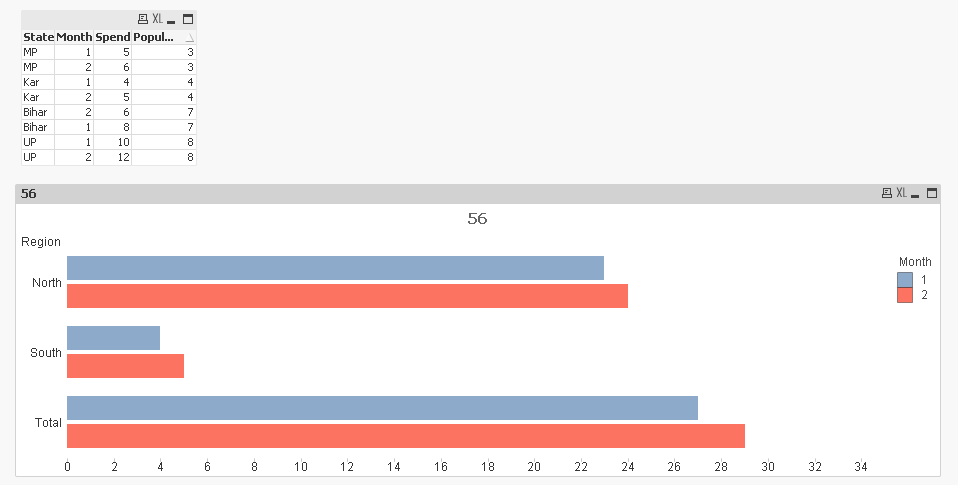
This is what you are looking to get?
- Mark as New
- Bookmark
- Subscribe
- Mute
- Subscribe to RSS Feed
- Permalink
- Report Inappropriate Content
Yes Sunny, Did you create any other inline table to refer the Region?
- Mark as New
- Bookmark
- Subscribe
- Mute
- Subscribe to RSS Feed
- Permalink
- Report Inappropriate Content
You can try to use Pick function here for your output.
Regards
Anand
- Mark as New
- Bookmark
- Subscribe
- Mute
- Subscribe to RSS Feed
- Permalink
- Report Inappropriate Content
I did... here is the script I used
Table:
LOAD If(Match(State, 'UP', 'MP', 'Bihar'), 'North', 'South') as Region,
*;
LOAD * INLINE [
State, Month, Spend, Population
UP, 1, 10, 8
MP, 1, 5, 3
Bihar, 1, 8, 7
Kar, 1, 4, 4
UP, 2, 12, 8
MP, 2, 6, 3
Bihar, 2, 6, 7
Kar, 2, 5, 4
];
LOAD * INLINE [
Dim
1
2
];