Unlock a world of possibilities! Login now and discover the exclusive benefits awaiting you.
- Qlik Community
- :
- All Forums
- :
- QlikView App Dev
- :
- Re: Help in expression
- Subscribe to RSS Feed
- Mark Topic as New
- Mark Topic as Read
- Float this Topic for Current User
- Bookmark
- Subscribe
- Mute
- Printer Friendly Page
- Mark as New
- Bookmark
- Subscribe
- Mute
- Subscribe to RSS Feed
- Permalink
- Report Inappropriate Content
Help in expression
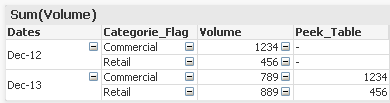
Hello got a pivot table with 2 dimensions (Month-Year) and Category
I got an expression very simple sum(Amount)
now what I want is demonstrated in the following image:

so for each month-year (I need to display the value of the last year's month-year
Please advise
- Mark as New
- Bookmark
- Subscribe
- Mute
- Subscribe to RSS Feed
- Permalink
- Report Inappropriate Content
Have you tried to have a look at Peek() function?
Peek function allows you to 'peek' to number of records you specify.
in your load script you can add this and you will 'peek' 1 record in your read table:
e.g. Peek(Dates,-1) as Peek_dates
- Mark as New
- Bookmark
- Subscribe
- Mute
- Subscribe to RSS Feed
- Permalink
- Report Inappropriate Content
I don't know how many combinations the end user may select
so it is not feasible to make it in the script as the selections are endless
- Mark as New
- Bookmark
- Subscribe
- Mute
- Subscribe to RSS Feed
- Permalink
- Report Inappropriate Content
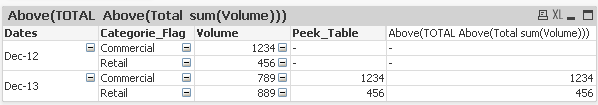
Hi, try this:
above(Total above( Total sum( volume)))
- Mark as New
- Bookmark
- Subscribe
- Mute
- Subscribe to RSS Feed
- Permalink
- Report Inappropriate Content
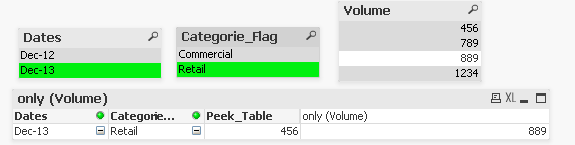
The whole script:
Table:
LOAD Dates,
Categorie_Flag,
Volume
FROM
load.txt
(txt, codepage is 1252, embedded labels, delimiter is ',', msq);
LOAD
Dates,
Categorie_Flag,
Volume,
Peek(Volume,-2) as Peek_Table
Resident Table
Order by Dates;
And I got this:
- Mark as New
- Bookmark
- Subscribe
- Mute
- Subscribe to RSS Feed
- Permalink
- Report Inappropriate Content
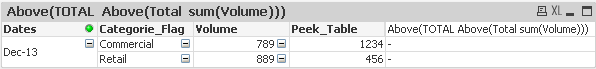
Staffan solution is cool, but as soon as you select e.g. 2013 year, it will not show you anything for volume. Despite the fact that there were volume data for 2012. See picture below:
- Mark as New
- Bookmark
- Subscribe
- Mute
- Subscribe to RSS Feed
- Permalink
- Report Inappropriate Content
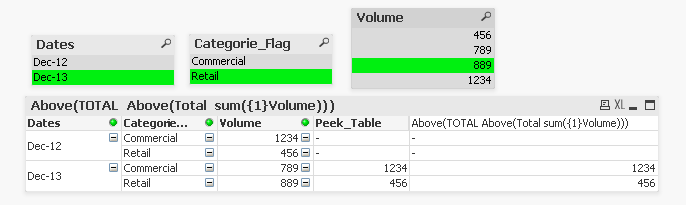
And much cooler:
above( total above( Total sum({1} volume)))

- Mark as New
- Bookmark
- Subscribe
- Mute
- Subscribe to RSS Feed
- Permalink
- Report Inappropriate Content
And might affect performance of the application more than the Peek ()
- Mark as New
- Bookmark
- Subscribe
- Mute
- Subscribe to RSS Feed
- Permalink
- Report Inappropriate Content
With the {1} you will always evaluate the full record set of all the data in the document - ignoring all your selections:
With peek() function:

- Mark as New
- Bookmark
- Subscribe
- Mute
- Subscribe to RSS Feed
- Permalink
- Report Inappropriate Content
That's why you should use the Peek() as I suggested
Table:
LOAD Dates,
Categorie_Flag,
Volume
FROM
load.txt
(txt, codepage is 1252, embedded labels, delimiter is ',', msq);
LOAD
Dates,
Categorie_Flag,
Volume,
Peek(Volume,-2) as Peek_Table
Resident Table
Order by Dates;