Unlock a world of possibilities! Login now and discover the exclusive benefits awaiting you.
- Qlik Community
- :
- All Forums
- :
- QlikView App Dev
- :
- Re: Help with box plot and using variables
- Subscribe to RSS Feed
- Mark Topic as New
- Mark Topic as Read
- Float this Topic for Current User
- Bookmark
- Subscribe
- Mute
- Printer Friendly Page
- Mark as New
- Bookmark
- Subscribe
- Mute
- Subscribe to RSS Feed
- Permalink
- Report Inappropriate Content
Help with box plot and using variables
Any help is appreciated.
I'm trying to create a boxplot that compares a selected company with other companies performance in their same industry segment.
I have created two variables for ease of use, vSO and vSOLines.
vSO value is =count(DISTINCT(so_id)) and vSOLines value is =count(so_id)
For the top box plot I have Fractile({<Customer = , Segment = p(Segment)>}vSOLinesequals/vSOequals,.75) since I want to graph the Lines per SO
I continue this for middle .5, and bottom .25.
However my plot looks like this, all that shows up is the lines.?
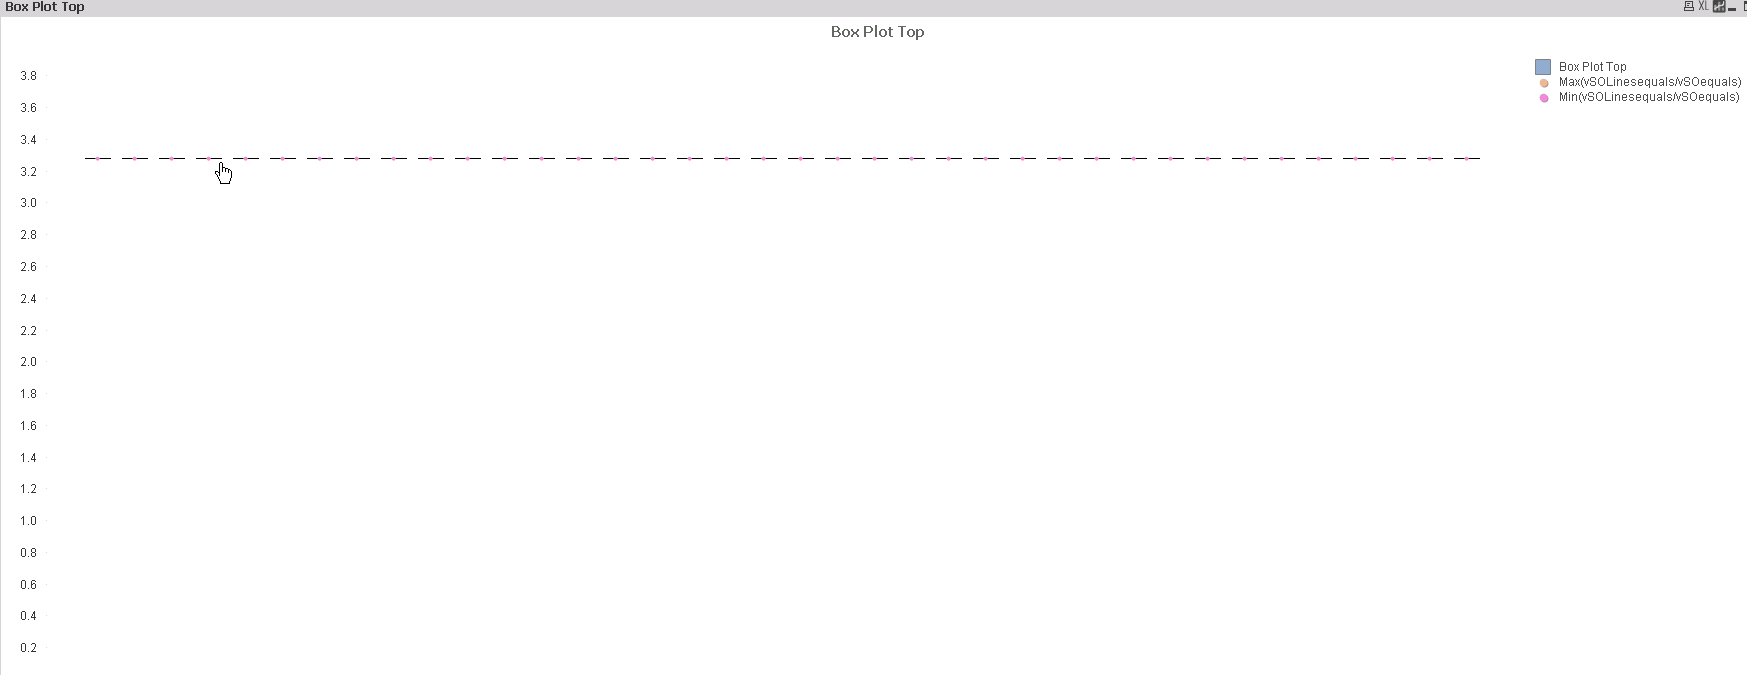
Any ideas?
- Mark as New
- Bookmark
- Subscribe
- Mute
- Subscribe to RSS Feed
- Permalink
- Report Inappropriate Content
What is vSOLinesequals and vSOequals?
- Mark as New
- Bookmark
- Subscribe
- Mute
- Subscribe to RSS Feed
- Permalink
- Report Inappropriate Content
SOLines is the number of lines in an order, SO is the number of orders.
the equals is the same variable, I just shortened it for convenience.
- Mark as New
- Bookmark
- Subscribe
- Mute
- Subscribe to RSS Feed
- Permalink
- Report Inappropriate Content
So they are expression? If that's true then try using them with Aggr() function
- Mark as New
- Bookmark
- Subscribe
- Mute
- Subscribe to RSS Feed
- Permalink
- Report Inappropriate Content
Aggr? In the Fractile?
This gives me an error in expression
Fractile(Aggr({<Customer = , Segment = p(Segment)>}vSOLinesequals/vSOequals),.75)
- Mark as New
- Bookmark
- Subscribe
- Mute
- Subscribe to RSS Feed
- Permalink
- Report Inappropriate Content
My friend.... this is not how this would work...  ... Would it be possible for you to share a sample or some sample data to help you better?
- Mark as New
- Bookmark
- Subscribe
- Mute
- Subscribe to RSS Feed
- Permalink
- Report Inappropriate Content
Sadly, I cannot share this data.
However, going off of this post,
I tried to duplicate it but I'm receiving an error that my chart says no data to display.
This is what I have now
Fractile(Aggr(Count([so_id])/count(DISTINCT[so_id]),Segment),.75)
Count(so_id) is the same as counting the lines, and with distinct, it is counting the orders.
Any ideas?
- Mark as New
- Bookmark
- Subscribe
- Mute
- Subscribe to RSS Feed
- Permalink
- Report Inappropriate Content
I am not asking to share this data... I am asking to mock up data so that we can see what you have.
How to get answers to your post?
Preparing examples for Upload - Reduction and Data Scrambling
- Mark as New
- Bookmark
- Subscribe
- Mute
- Subscribe to RSS Feed
- Permalink
- Report Inappropriate Content
| Customer |
|---|
Acme |
| Bean |
| Crimson |
| Deloitte |
| Segment |
|---|
| Lumber |
| Roofing |
Stone |
| so_id |
|---|
1 |
| 2 |
| 3 |
| 4 |
| 5 |
These are the main tables. For each so_id, such as so_id 1, it can appear many times in the data. So I use a count of the so_id, so if 1 appears 13 times, then we call that the # of lines in so_id 1.
I want to view Bean, which is in the Lumber industry, and see it's lines per so_id compared to other companies in the same Segment.
I need this in a box plot view, and am currently struggling.
- Mark as New
- Bookmark
- Subscribe
- Mute
- Subscribe to RSS Feed
- Permalink
- Report Inappropriate Content
I don't really understand... I am sure someone else can help you better.
Best,
Sunny