Unlock a world of possibilities! Login now and discover the exclusive benefits awaiting you.
- Qlik Community
- :
- All Forums
- :
- QlikView App Dev
- :
- Horizontal Bar Chart - Values on Data Points - Mis...
- Subscribe to RSS Feed
- Mark Topic as New
- Mark Topic as Read
- Float this Topic for Current User
- Bookmark
- Subscribe
- Mute
- Printer Friendly Page
- Mark as New
- Bookmark
- Subscribe
- Mute
- Subscribe to RSS Feed
- Permalink
- Report Inappropriate Content
Horizontal Bar Chart - Values on Data Points - Misaligned

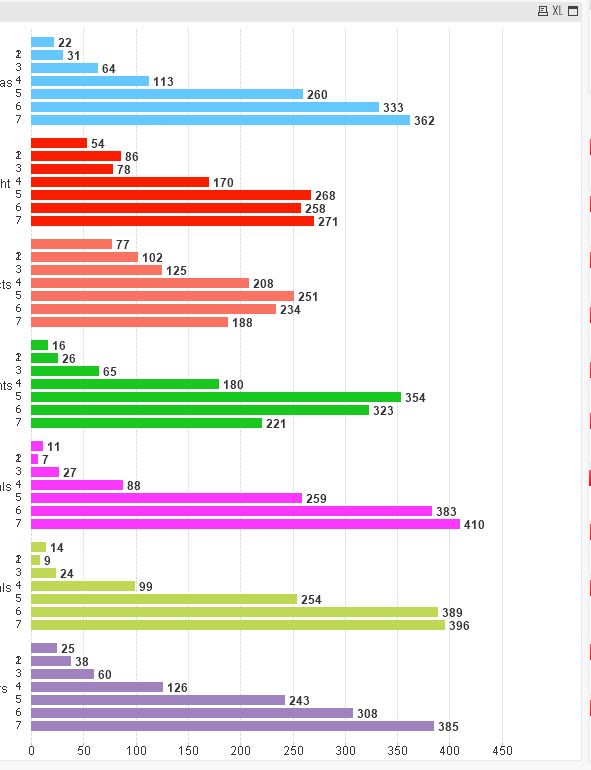
As you can see from the image above, I have a horizontal bar chart with some of the expression values on the data points and some on the x-axis. The values on the x-axis are misaligned, though, so that in each group the first and second value overlap (the 1 and the 2). I've tried this with other values and the same problem seems to come up. There doesn't seem to be a way to align the axis itself to give more space to the first value.
Has anyone come across this problem before? Were you able to solve it?
This is the only way I could figure out to get the values 1-7 to show up for each of my grouped values--if there's a better way of doing that than making it an expression, I'm happy to hear it!
Accepted Solutions
- Mark as New
- Bookmark
- Subscribe
- Mute
- Subscribe to RSS Feed
- Permalink
- Report Inappropriate Content
Hi Marcus & Catlin,
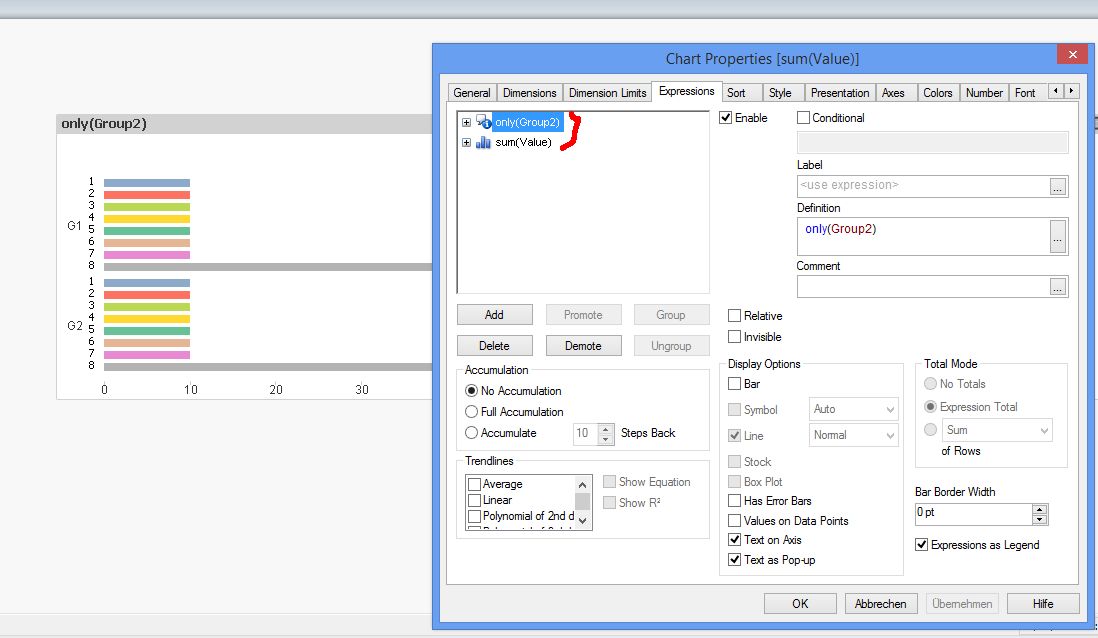
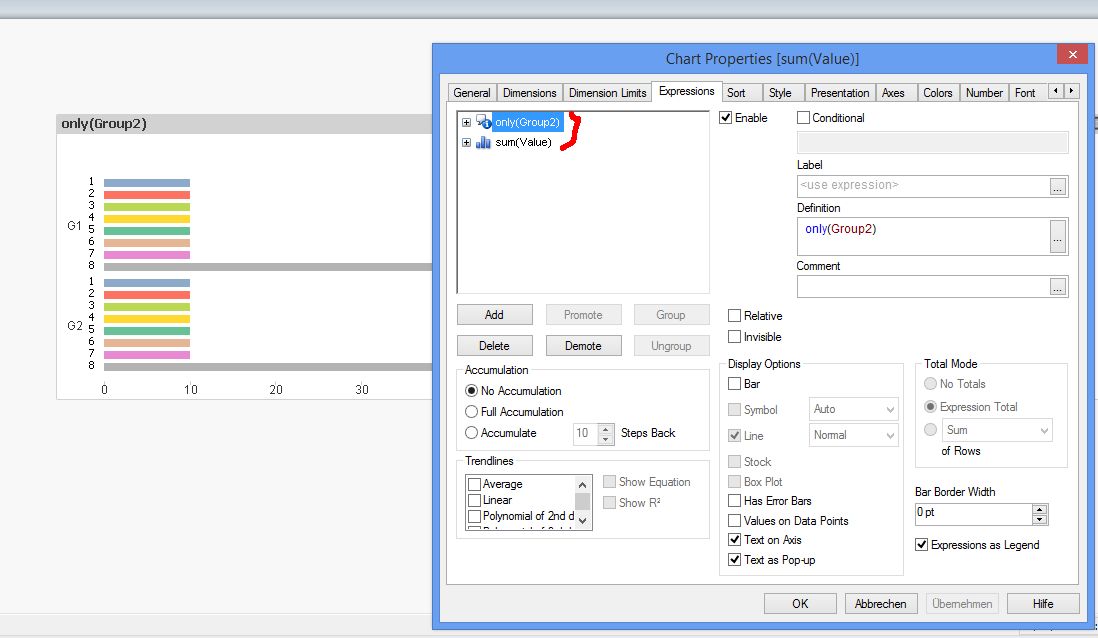
if you promote your second expression to the 1. place, the problem is solved. See the picture:

Hope this helps
Burkhard
- Mark as New
- Bookmark
- Subscribe
- Mute
- Subscribe to RSS Feed
- Permalink
- Report Inappropriate Content
have you tried this -
click in the chart to make it active and then hold down shift+ctrl, red boundaries within the chart. these boundaries can be dragged to adjust the spaces. try giving more room for the x axis and see if it helps.
- Mark as New
- Bookmark
- Subscribe
- Mute
- Subscribe to RSS Feed
- Permalink
- Report Inappropriate Content
Could you share a sample qvw?
- Mark as New
- Bookmark
- Subscribe
- Mute
- Subscribe to RSS Feed
- Permalink
- Report Inappropriate Content
Thanks, I did try that before and it didn't make a difference.
- Mark as New
- Bookmark
- Subscribe
- Mute
- Subscribe to RSS Feed
- Permalink
- Report Inappropriate Content
Hello Robert, I believe this is more an issue of design selections in the chart properties than one of data structure. It seems to happen no matter what kinds of data I put on the X axis.
I actually think this may be a bug that needs to be reported to Qlik, but I wanted to check whether anyone else had experienced similar issues before I did that.
- Mark as New
- Bookmark
- Subscribe
- Mute
- Subscribe to RSS Feed
- Permalink
- Report Inappropriate Content
Hi Caitlin,
I'm seeing the same issue on a test file (attached).
Marcus
- Mark as New
- Bookmark
- Subscribe
- Mute
- Subscribe to RSS Feed
- Permalink
- Report Inappropriate Content
Hi Marcus & Catlin,
if you promote your second expression to the 1. place, the problem is solved. See the picture:

Hope this helps
Burkhard
- Mark as New
- Bookmark
- Subscribe
- Mute
- Subscribe to RSS Feed
- Permalink
- Report Inappropriate Content
- Mark as New
- Bookmark
- Subscribe
- Mute
- Subscribe to RSS Feed
- Permalink
- Report Inappropriate Content
Thanks Burkhard, that worked perfectly! I'm still confused about why the order would make a difference, but as long as it works I'm happy ![]()
