Unlock a world of possibilities! Login now and discover the exclusive benefits awaiting you.
- Qlik Community
- :
- All Forums
- :
- QlikView App Dev
- :
- Re: How can I calculate ratio in charts
- Subscribe to RSS Feed
- Mark Topic as New
- Mark Topic as Read
- Float this Topic for Current User
- Bookmark
- Subscribe
- Mute
- Printer Friendly Page
- Mark as New
- Bookmark
- Subscribe
- Mute
- Subscribe to RSS Feed
- Permalink
- Report Inappropriate Content
How can I calculate ratio in charts
Hello Community
I am a freshman in using QlikView and try to show ratios in a bar chart.
I have a set of records of examinations in a radiology department an I want to show the ratio of outpatients to inpatient for different years.
Could anybody help me how I can calculate this ratio.
Thank you
Achim
- Tags:
- new_to_qlikview
- ratio
- « Previous Replies
-
- 1
- 2
- Next Replies »
- Mark as New
- Bookmark
- Subscribe
- Mute
- Subscribe to RSS Feed
- Permalink
- Report Inappropriate Content
post some sample data
- Mark as New
- Bookmark
- Subscribe
- Mute
- Subscribe to RSS Feed
- Permalink
- Report Inappropriate Content
e.g. sum(outpatients)/sum(inpatient)*100 within the expression field of your chart, and then as a dimension, you select the year.
- Mark as New
- Bookmark
- Subscribe
- Mute
- Subscribe to RSS Feed
- Permalink
- Report Inappropriate Content
HI Achim,
Take Year is in X Axis and in Expression use Sum(outpatients)/Sum(inpatient)*100 hope it will get your desired results.
- Mark as New
- Bookmark
- Subscribe
- Mute
- Subscribe to RSS Feed
- Permalink
- Report Inappropriate Content
Dear All
Thank you for your help.
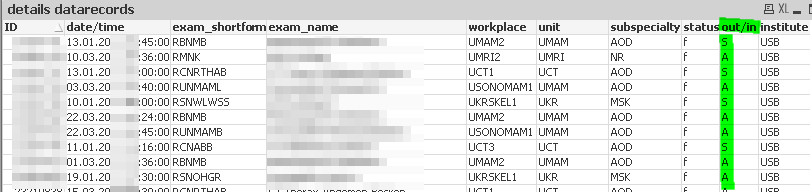
But I not sure if that will help me out. I have the information for in- and outpatients in a single field in my data (Field "out/in" > see attached image). If I use count or sum as the expression, how can I aggregate all records with status "A" for outpatients and "S" for inpatients?
And I want to have this KPI dynamic. So, if I will filter for e.g. the unit I want to have the outpatient-to-all-ratio just for the specific unit.
Thank you@
- Mark as New
- Bookmark
- Subscribe
- Mute
- Subscribe to RSS Feed
- Permalink
- Report Inappropriate Content
Hello Achim,
I'd separate the value then in the script first, so that you can work easier with it afterwards.
Datafile:
Load *,
1 as Outpatient,
0 as Inpatient
FROM .....
WHERE out/in = A;
concatenate
Load *,
1 as Inpatient,
0 as Outpatient
FROM .....
WHERE out/in = S;
Filtering won't give you issues in this case.
- Mark as New
- Bookmark
- Subscribe
- Mute
- Subscribe to RSS Feed
- Permalink
- Report Inappropriate Content
Hello Johan
Thank you for that solution and I think that will work.
But I wonder if there is a way to calculate this ration within the expression window of the measure.
As measure I tried the expression:
count({<[out/in]={'A'}>} [out/in])
The result was the right number of inpatients. Then I thought it should be possible to calculate the ratio by using the following expression:
count({<[out/in]={'A'}>} [out/in])/(count({<[out/in]={'S'}>} [out/in])+count({<[out/in]={'A'}>} [out/in]))
Seems to be simple and logic for me, but it does not work. As you can see in the screenshot all values for the different years are 1 (= 100%).
Do you have any idea. Am I totally wrong? 🙂
Thanks
Achim
- Mark as New
- Bookmark
- Subscribe
- Mute
- Subscribe to RSS Feed
- Permalink
- Report Inappropriate Content
Hello Achim,
It's a good idea. I wonder why you make it so hard in the second part of the equation. wouldn't it work with count([out/in]). You basically take together all fields no?
Another way to start testing the formula, is in a 'text object' on your presentation sheet. If you create 2, and you test both the first part and the second part of your formula. If those 2 parts give you the desired results, you enter a third which tests the complete formula. If that one is ok, you copy this to your expression field.
Regards,
Johan
- Mark as New
- Bookmark
- Subscribe
- Mute
- Subscribe to RSS Feed
- Permalink
- Report Inappropriate Content
Good Morning Johan
That was my first idea too.
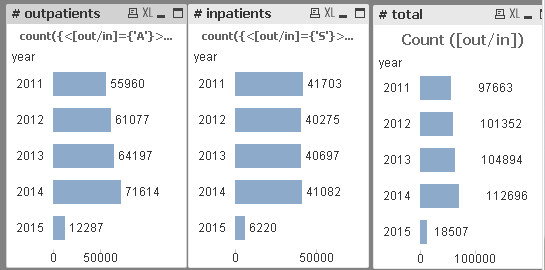
I used the following expression:
count({<[out/in]={'A'}>} [out/in])/Count ([out/in])
But it just led to the same results that I have shown above. For all years the ratio is 100%. As you suggested I tried the different parts in three different charts and it led to the right absolute values as you can see in the screenshot. But as soon as I combine the parts of the expression it doesn't work.
Just don't understand this.
Regards
Achim
- Mark as New
- Bookmark
- Subscribe
- Mute
- Subscribe to RSS Feed
- Permalink
- Report Inappropriate Content
Any chance you can share your script and some data?
- « Previous Replies
-
- 1
- 2
- Next Replies »