Unlock a world of possibilities! Login now and discover the exclusive benefits awaiting you.
- Qlik Community
- :
- All Forums
- :
- QlikView App Dev
- :
- Re: How can I filter the dimension to a certain ti...
- Subscribe to RSS Feed
- Mark Topic as New
- Mark Topic as Read
- Float this Topic for Current User
- Bookmark
- Subscribe
- Mute
- Printer Friendly Page
- Mark as New
- Bookmark
- Subscribe
- Mute
- Subscribe to RSS Feed
- Permalink
- Report Inappropriate Content
How can I filter the dimension to a certain time but ignore this selection in the expressions?
Hello everyone,
I need a diagram in QlikView which shows how many receipts have reached "NewState ='2'" for the first time (and several similar diagrams). Further the user needs to have the possibility to dynamically select the month that this diagram is showing by selecting a date-range.
I’ve got a table which looks like this:
| Key | Date | OldState | NewState |
|---|---|---|---|
Receipt1 | 20.12.2015 14:01:51 | 1 | |
| Receipt1 | 19.02.2016 16:02:24 | 1 | 2 |
| Receipt1 | 22.02.2016 11:09:33 | 2 | 8 |
| Receipt1 | 01.03.2016 18:15:04 | 8 | 2 |
| Receipt2 | 06.04.2016 07:05:50 | 1 | |
| Receipt2 | 07:09:2016 12:31:14 | 1 | 4 |
| ... |
I’ve tried the following ideas so far:
For Dimension I use:
Year(Date) & '/’'& Num(Month(Date), '00')
This should sort the receipts to the month in which they reached the state and allow filtering for the user according to the month.
As Expression, I’ve currently implemented the following formula:
Count( {< Date=, NewState = {'02'}>}
Aggr( Min( {< Date= >} Date),
Key, NewState
)
)
This was the only solution which outputs the correct values. However, with these formulas, I cannot make the diagram show only certain months when a user selects a date-range. The diagram always shows all months. I know why this does not work, but I have no idea, how I could change the formula to make it work correctly.
For more detailed explanation:
Whenever I don’t set the set-analysis expression ("Date=") to ignore the selection for date, the diagram ignores all receipts which are not in that date-range. But I only want to count receipts if they are in State '2' for the FIRST time overall!
I’ve also tried to work with variables and make the dimension only show dates when they are between my two own date variables ( if ( date < myVarDate ….). But changes to my variables still do change my counted values per month, so that’s not working either.
Please can someone help me; I’ve really done a lot of research on the topic and would be very grateful for any help!
- Mark as New
- Bookmark
- Subscribe
- Mute
- Subscribe to RSS Feed
- Permalink
- Report Inappropriate Content
First thing you can use preceding load to get same format for your Dimension
Date(MonthName(Date),'MM YYYY') as MonthYear
Load * Inline [
Bla Bla
Bla Bla
Bla Bla
];
Then use Dim as MonthYear of your object
Expression,
When you use this what was the problem
Count( {< Date=, NewState = {'02'}>} Aggr(Min( {< Date= >} Date), Key, NewState))
May be use this, I've added simple $ symbol for sorting effect
Count({$< Date=, NewState = {'02'}>} Aggr( Min( {< Date= >} Date), Key, NewState))
- Mark as New
- Bookmark
- Subscribe
- Mute
- Subscribe to RSS Feed
- Permalink
- Report Inappropriate Content
Thanks Anil Babu,
your proposed changes to the Dimension are working and make my formulas shorter now.
However, the change to the Expression is not working. It still does show me all years and months since the beginning of our documentation, even when I select a certain date. This is still due to the fact, that the Expression calculates all values (ignoring the selection) and, thus, there are values for the whole Dimension-range to show.
- Mark as New
- Bookmark
- Subscribe
- Mute
- Subscribe to RSS Feed
- Permalink
- Report Inappropriate Content
May be the problem with NewState over here. Because, While selection some value from date it might no values from NewState. You already sorting one value for NewState. So, It won't effect in set analysis once one value is sorting.
Can you describe more in detail with data and expected output
Try a luck
Count({$< Date= P(Date), NewState = {'02'}>} Aggr(Min({< Date= P(Date)>} Date),Key,NewState))
- Mark as New
- Bookmark
- Subscribe
- Mute
- Subscribe to RSS Feed
- Permalink
- Report Inappropriate Content
Hello,
Your new answer does indeed re-enable the filtering possibility, but now I’m confronted with the same problem that I had without the set-analysis "Date=".
I'll gladly describe my scenario in more detail.
Without any selection, I've got the following diagram:
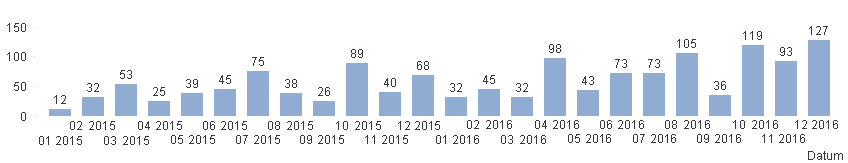
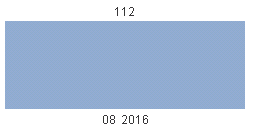
This correctly shows me the number of any receipt that hits the state '02' for the first time in the corresponding month. However, once I select a date in order to make the diagram only show certain months, I either get no reaction (first solution from my initial post) or all values change since the calculations only sees receipts which are created in this month, but NOT the receipts with the same key but in previous months. For example, if I select August 2016 the result is as follows (compared to 105 as before):
The corresponding data has the following characteristics:
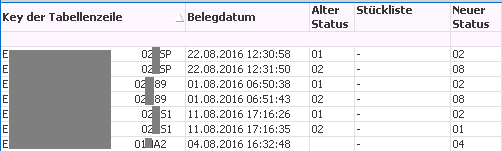
As you can see, any receipt (Key der Tabellenzeile) has a unique number and can get different states (which follow our workflow). The receipt 02..S1 is having a "step backwards" so it is in state 01 twice and will later get to state 02 again. This could have happened as well to receipt 02..89, that means that it might have been in state 02 already in June but in August again. If I select August, I do not want to count this receipt for that month, because it hits 02 there for the second time. But exactly that is happening with all my approaches, once I select a certain date rage, except with the first proposed approach. But my first approach does not allow filtering at all.
I hope I could make things clearer.
- Mark as New
- Bookmark
- Subscribe
- Mute
- Subscribe to RSS Feed
- Permalink
- Report Inappropriate Content
Hello again,
I can also make a small example application if this would help . I'm really glad for any support.