Unlock a world of possibilities! Login now and discover the exclusive benefits awaiting you.
- Qlik Community
- :
- All Forums
- :
- QlikView App Dev
- :
- How can I group a dimension by percentage in a piv...
- Subscribe to RSS Feed
- Mark Topic as New
- Mark Topic as Read
- Float this Topic for Current User
- Bookmark
- Subscribe
- Mute
- Printer Friendly Page
- Mark as New
- Bookmark
- Subscribe
- Mute
- Subscribe to RSS Feed
- Permalink
- Report Inappropriate Content
How can I group a dimension by percentage in a pivot table?
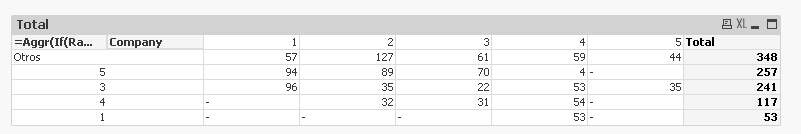
I am trying in a pivot table (two dimensiones: passengers as rows and Company as colums) to display at a total level the top passengers that reach 80% of tickets.
The other passengers that are not inside the top 80% should appear grouped as as Others.
I am trying with the following dimensions:
if (RangeSum(Above(Sum(Tickets),0,RowNo()))/sum(total Tickets)<'0,8',Passenger,'Otros')
However, I get the allocated memory exceede message.
Can anyone help me?
Accepted Solutions
- Mark as New
- Bookmark
- Subscribe
- Mute
- Subscribe to RSS Feed
- Permalink
- Report Inappropriate Content
Try this as your calculated dimension
=Aggr(If(RangeSum(Above(Sum(Tickets),0,RowNo()))/Sum(TOTAL <Company> Tickets) < '0,8', Passenger,'Otros'), Company, (Passenger, (=Sum(Tickets), DESC)))
- Mark as New
- Bookmark
- Subscribe
- Mute
- Subscribe to RSS Feed
- Permalink
- Report Inappropriate Content
Thank you Sunny,
We are close, but I still get the "allocated memory exceeded" issue in the document you attached,.
- Mark as New
- Bookmark
- Subscribe
- Mute
- Subscribe to RSS Feed
- Permalink
- Report Inappropriate Content
Which version of QlikView are you using?
- Mark as New
- Bookmark
- Subscribe
- Mute
- Subscribe to RSS Feed
- Permalink
- Report Inappropriate Content
The syntax I used is only available in QlikView 12.1 or above
- Mark as New
- Bookmark
- Subscribe
- Mute
- Subscribe to RSS Feed
- Permalink
- Report Inappropriate Content
Thank you Sunny,
I am using version 11.2. Do you know if there is any possible syntax for this version?
- Mark as New
- Bookmark
- Subscribe
- Mute
- Subscribe to RSS Feed
- Permalink
- Report Inappropriate Content
It's not nice, but take a look here