Unlock a world of possibilities! Login now and discover the exclusive benefits awaiting you.
Announcements
Introducing Qlik Answers: A plug-and-play, Generative AI powered RAG solution.
READ ALL ABOUT IT!
- Qlik Community
- :
- All Forums
- :
- QlikView App Dev
- :
- How can I make an broken line on the chart in Qlik...
Options
- Subscribe to RSS Feed
- Mark Topic as New
- Mark Topic as Read
- Float this Topic for Current User
- Bookmark
- Subscribe
- Mute
- Printer Friendly Page
Turn on suggestions
Auto-suggest helps you quickly narrow down your search results by suggesting possible matches as you type.
Showing results for
Partner - Contributor
2019-02-05
05:30 AM
- Mark as New
- Bookmark
- Subscribe
- Mute
- Subscribe to RSS Feed
- Permalink
- Report Inappropriate Content
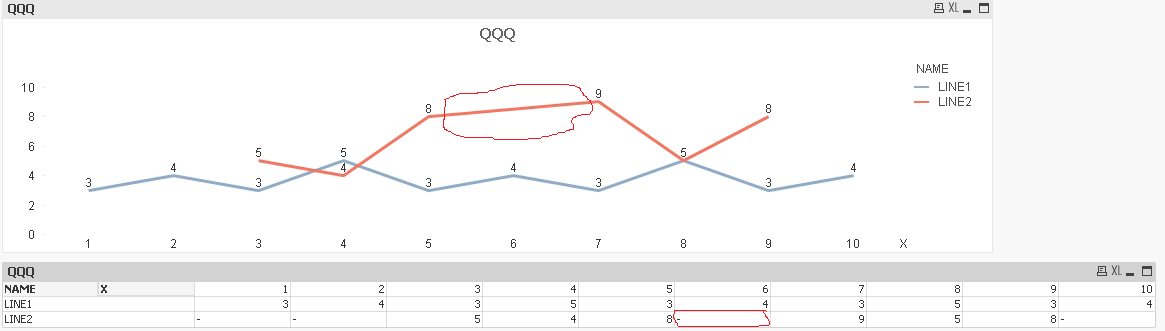
How can I make an broken line on the chart in QlikVeiw?
I have months sales data by a lot of objects.
For example, in june 2018 we have not sales for one object. It isn't zero meaning, it is missing value. That is why sales dynamic from may to july 2018 should not be connected by line on the chart.
330 Views
2 Replies
Master II
2019-02-05
05:40 AM
- Mark as New
- Bookmark
- Subscribe
- Mute
- Subscribe to RSS Feed
- Permalink
- Report Inappropriate Content
if you want it be zero then
use alt(measure_field,0) as measure_field
or
if(len(trim(measure_field))=0,0,measure_field) as measure_field
then use it in the chart
use alt(measure_field,0) as measure_field
or
if(len(trim(measure_field))=0,0,measure_field) as measure_field
then use it in the chart
Learning never stops.
327 Views
Creator II
2019-02-05
06:43 AM
- Mark as New
- Bookmark
- Subscribe
- Mute
- Subscribe to RSS Feed
- Permalink
- Report Inappropriate Content
You should use background color property for expressions to hide missing parts.
See example in attachment