Unlock a world of possibilities! Login now and discover the exclusive benefits awaiting you.
- Qlik Community
- :
- All Forums
- :
- QlikView App Dev
- :
- Re: How do I add a conditional "Trend line" for a ...
- Subscribe to RSS Feed
- Mark Topic as New
- Mark Topic as Read
- Float this Topic for Current User
- Bookmark
- Subscribe
- Mute
- Printer Friendly Page
- Mark as New
- Bookmark
- Subscribe
- Mute
- Subscribe to RSS Feed
- Permalink
- Report Inappropriate Content
How do I add a conditional "Trend line" for a bar chart?
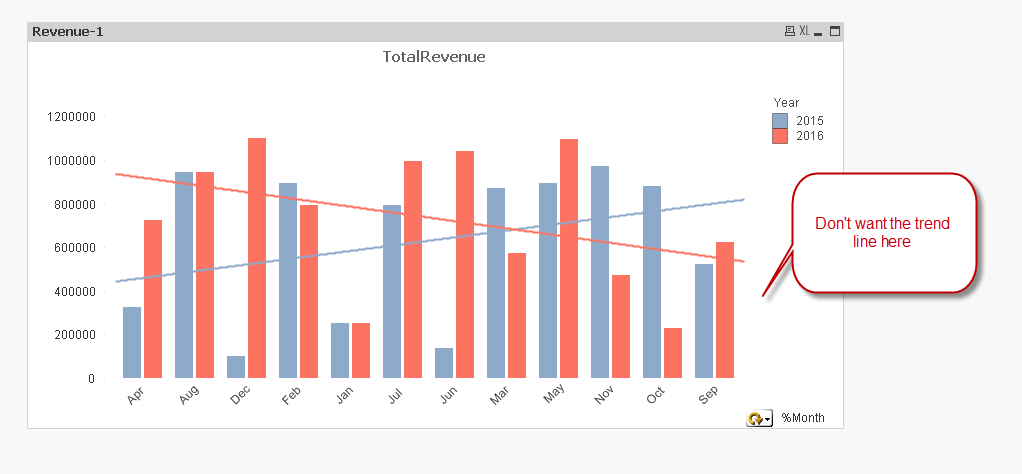
I have a bar chart with cyclic group. I want to add "Linear" trend line to bar chart (Expression-> trend line). But This trend line apprears to both cyclic group. I want it only for one. Is that possible?
I have attached an example: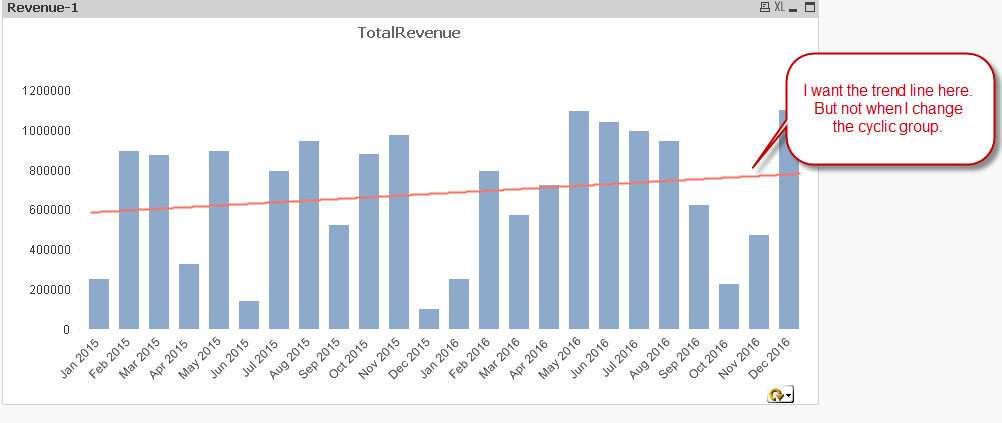
- « Previous Replies
-
- 1
- 2
- Next Replies »
Accepted Solutions
- Mark as New
- Bookmark
- Subscribe
- Mute
- Subscribe to RSS Feed
- Permalink
- Report Inappropriate Content
You can use Linest functions to create the trend line and make it condition to show only when your on certain cycle group
linest_M(total aggr(Sum(%Revenue), MonthYear),MonthYear)*MonthYear + linest_b(total aggr(Sum(%Revenue),MonthYear),MonthYear)
But for this to work, I had to create a MonthYear field in the script. New script:
DateDemo:
LOAD *,
Date(MonthStart(Date#(%Month & '-' & %year, 'MMM-YYYY')), 'MMM YYYY') as MonthYear;
LOAD * INLINE [
%Month, %year, %Revenue
Jan,2015,250000
Feb,2015,895456
Mar,2015,871594
Apr,2015,324791
May,2015,894157
Jun,2015,139714
Jul,2015,794351
Aug,2015,946321
Sep,2015,521493
Oct,2015,879423
Nov,2015,974126
Dec,2015,100357
Jan,2016,250842
Feb,2016,795456
Mar,2016,571594
Apr,2016,724791
May,2016,1094157
Jun,2016,1039714
Jul,2016,994351
Aug,2016,946321
Sep,2016,621493
Oct,2016,227942
Nov,2016,474126
Dec,2016,1100357
];
Now when you use the expression, you can see how it works. When on MonthYear dimension
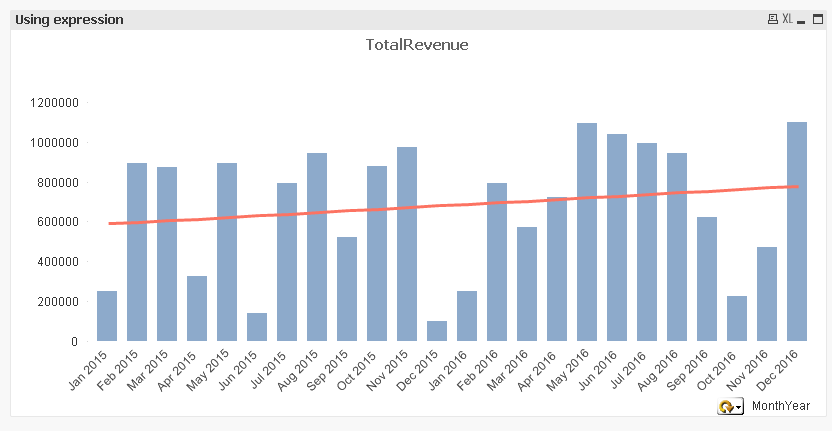
When on % Month dimension
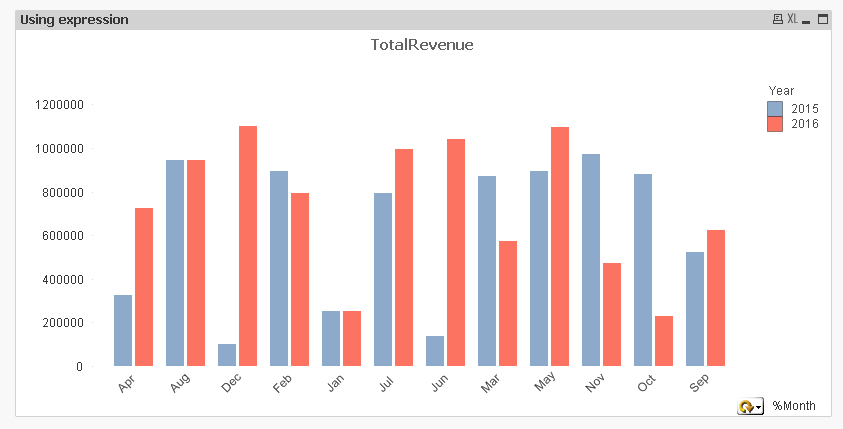
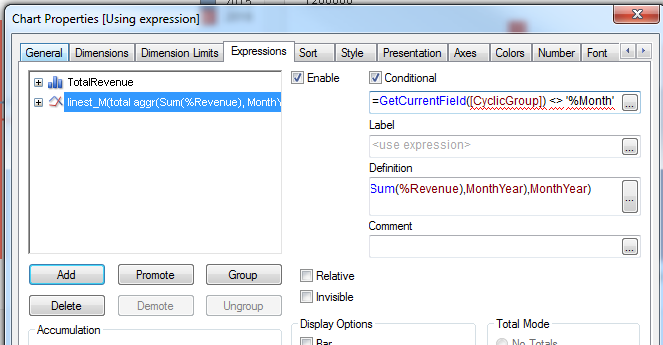
Hide show condition for the trend line is this
=GetCurrentField([CyclicGroup]) <> '%Month'
- Mark as New
- Bookmark
- Subscribe
- Mute
- Subscribe to RSS Feed
- Permalink
- Report Inappropriate Content
That will be not possible currently. What I suggest is using a two graphs with a inline table (%Month, MonthYear), in this way you can toggle between the charts and your trend line can be different.
- Mark as New
- Bookmark
- Subscribe
- Mute
- Subscribe to RSS Feed
- Permalink
- Report Inappropriate Content
Without cyclic group, how do I toggle between the graphs?
- Mark as New
- Bookmark
- Subscribe
- Mute
- Subscribe to RSS Feed
- Permalink
- Report Inappropriate Content
You can use Linest functions to create the trend line and make it condition to show only when your on certain cycle group
linest_M(total aggr(Sum(%Revenue), MonthYear),MonthYear)*MonthYear + linest_b(total aggr(Sum(%Revenue),MonthYear),MonthYear)
But for this to work, I had to create a MonthYear field in the script. New script:
DateDemo:
LOAD *,
Date(MonthStart(Date#(%Month & '-' & %year, 'MMM-YYYY')), 'MMM YYYY') as MonthYear;
LOAD * INLINE [
%Month, %year, %Revenue
Jan,2015,250000
Feb,2015,895456
Mar,2015,871594
Apr,2015,324791
May,2015,894157
Jun,2015,139714
Jul,2015,794351
Aug,2015,946321
Sep,2015,521493
Oct,2015,879423
Nov,2015,974126
Dec,2015,100357
Jan,2016,250842
Feb,2016,795456
Mar,2016,571594
Apr,2016,724791
May,2016,1094157
Jun,2016,1039714
Jul,2016,994351
Aug,2016,946321
Sep,2016,621493
Oct,2016,227942
Nov,2016,474126
Dec,2016,1100357
];
Now when you use the expression, you can see how it works. When on MonthYear dimension
When on % Month dimension
Hide show condition for the trend line is this
=GetCurrentField([CyclicGroup]) <> '%Month'
- Mark as New
- Bookmark
- Subscribe
- Mute
- Subscribe to RSS Feed
- Permalink
- Report Inappropriate Content
Make a inline table like
TrendLineIsland:
LOAD * INLINE [
TrendlineShow
Original
Accumulated
];
And use this as Selection box instead of cycle group, you can always show/hide graph using layout tab.
But Sunny Solution will work best, if you try it out.
- Mark as New
- Bookmark
- Subscribe
- Mute
- Subscribe to RSS Feed
- Permalink
- Report Inappropriate Content
You are awesome! This is what I wanted to do. Thank you so much. I will try this on my data and let you know.
- Mark as New
- Bookmark
- Subscribe
- Mute
- Subscribe to RSS Feed
- Permalink
- Report Inappropriate Content
Thank you for your help.
- Mark as New
- Bookmark
- Subscribe
- Mute
- Subscribe to RSS Feed
- Permalink
- Report Inappropriate Content
Sure thing 
- Mark as New
- Bookmark
- Subscribe
- Mute
- Subscribe to RSS Feed
- Permalink
- Report Inappropriate Content
Worked just fine. I do have one question. If I already have a column called MonthYear (In this format: 'YYYY-MM' for example '2016-03'). What will be the "Linest" function or what else we have to change in the script?
Thanks
Pavithra Shetty
- Mark as New
- Bookmark
- Subscribe
- Mute
- Subscribe to RSS Feed
- Permalink
- Report Inappropriate Content
If you MonthYear field is created using a date function then you can simply replace my MonthYear field with yours on the front end. Not changes should be needed in the script I believe.
Best,
Sunny
- « Previous Replies
-
- 1
- 2
- Next Replies »