Unlock a world of possibilities! Login now and discover the exclusive benefits awaiting you.
- Qlik Community
- :
- All Forums
- :
- QlikView App Dev
- :
- How do I calculate the expression dynamically or t...
- Subscribe to RSS Feed
- Mark Topic as New
- Mark Topic as Read
- Float this Topic for Current User
- Bookmark
- Subscribe
- Mute
- Printer Friendly Page
- Mark as New
- Bookmark
- Subscribe
- Mute
- Subscribe to RSS Feed
- Permalink
- Report Inappropriate Content
How do I calculate the expression dynamically or through program?
Hello Experts,
Need your help with the following. Attached file contains sample data . This contains credit card usage data for one particular credit card on monthly basis.
When User selects a Particular Month, I want to display a graph of 10% incremental value(difference between max and min amount charged) charged_amount, number of users who spent the amount and total sum of those users
My data as per excel as per below image.
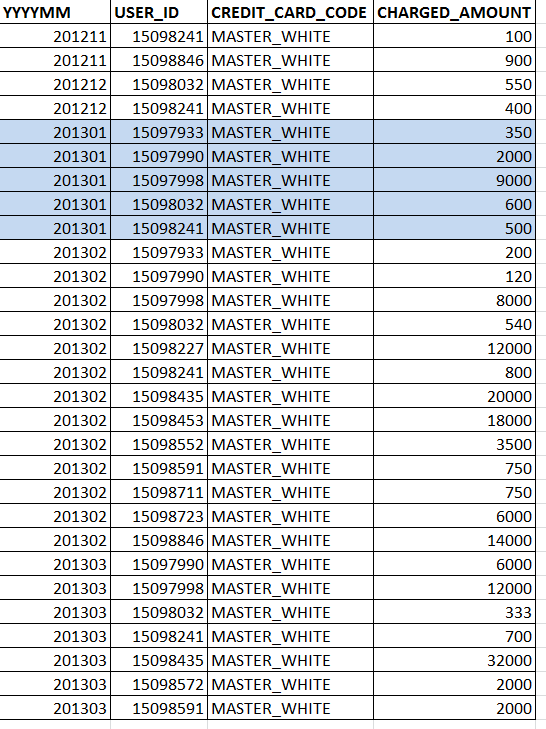
For example, If Month is 201301,
Lowest Amount is 350
Highest Amount is 9000
So the expression starts from 0 <350 then increment by 10% of difference between maximum amount and minimum amount charged((9000-350)/10)
We want to know every 10% increment number of users and total amount spent during the month by these group of users.
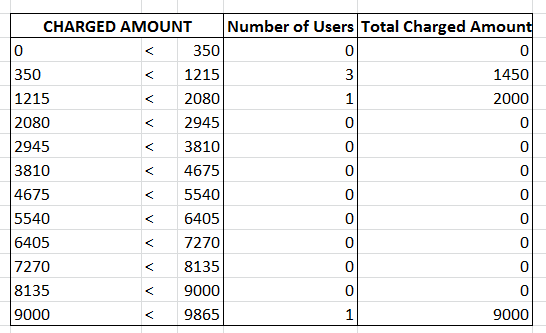
Manually calculated results as follows.
How do I implement this?
Thank you.
- Tags:
- new_to_qlikview
- Mark as New
- Bookmark
- Subscribe
- Mute
- Subscribe to RSS Feed
- Permalink
- Report Inappropriate Content
Hi,
Find the attached file it is very helpfull for you
- Mark as New
- Bookmark
- Subscribe
- Mute
- Subscribe to RSS Feed
- Permalink
- Report Inappropriate Content
Hi Kumar
Thank you for the help. In your suggestion you have hard coded the values for Dimension. In typical scenario this values and range is dynamic. Jan range is 350-9000 but in Some other month it may be 100-15000. So we should calculate this value dynamically
In addition there is an error
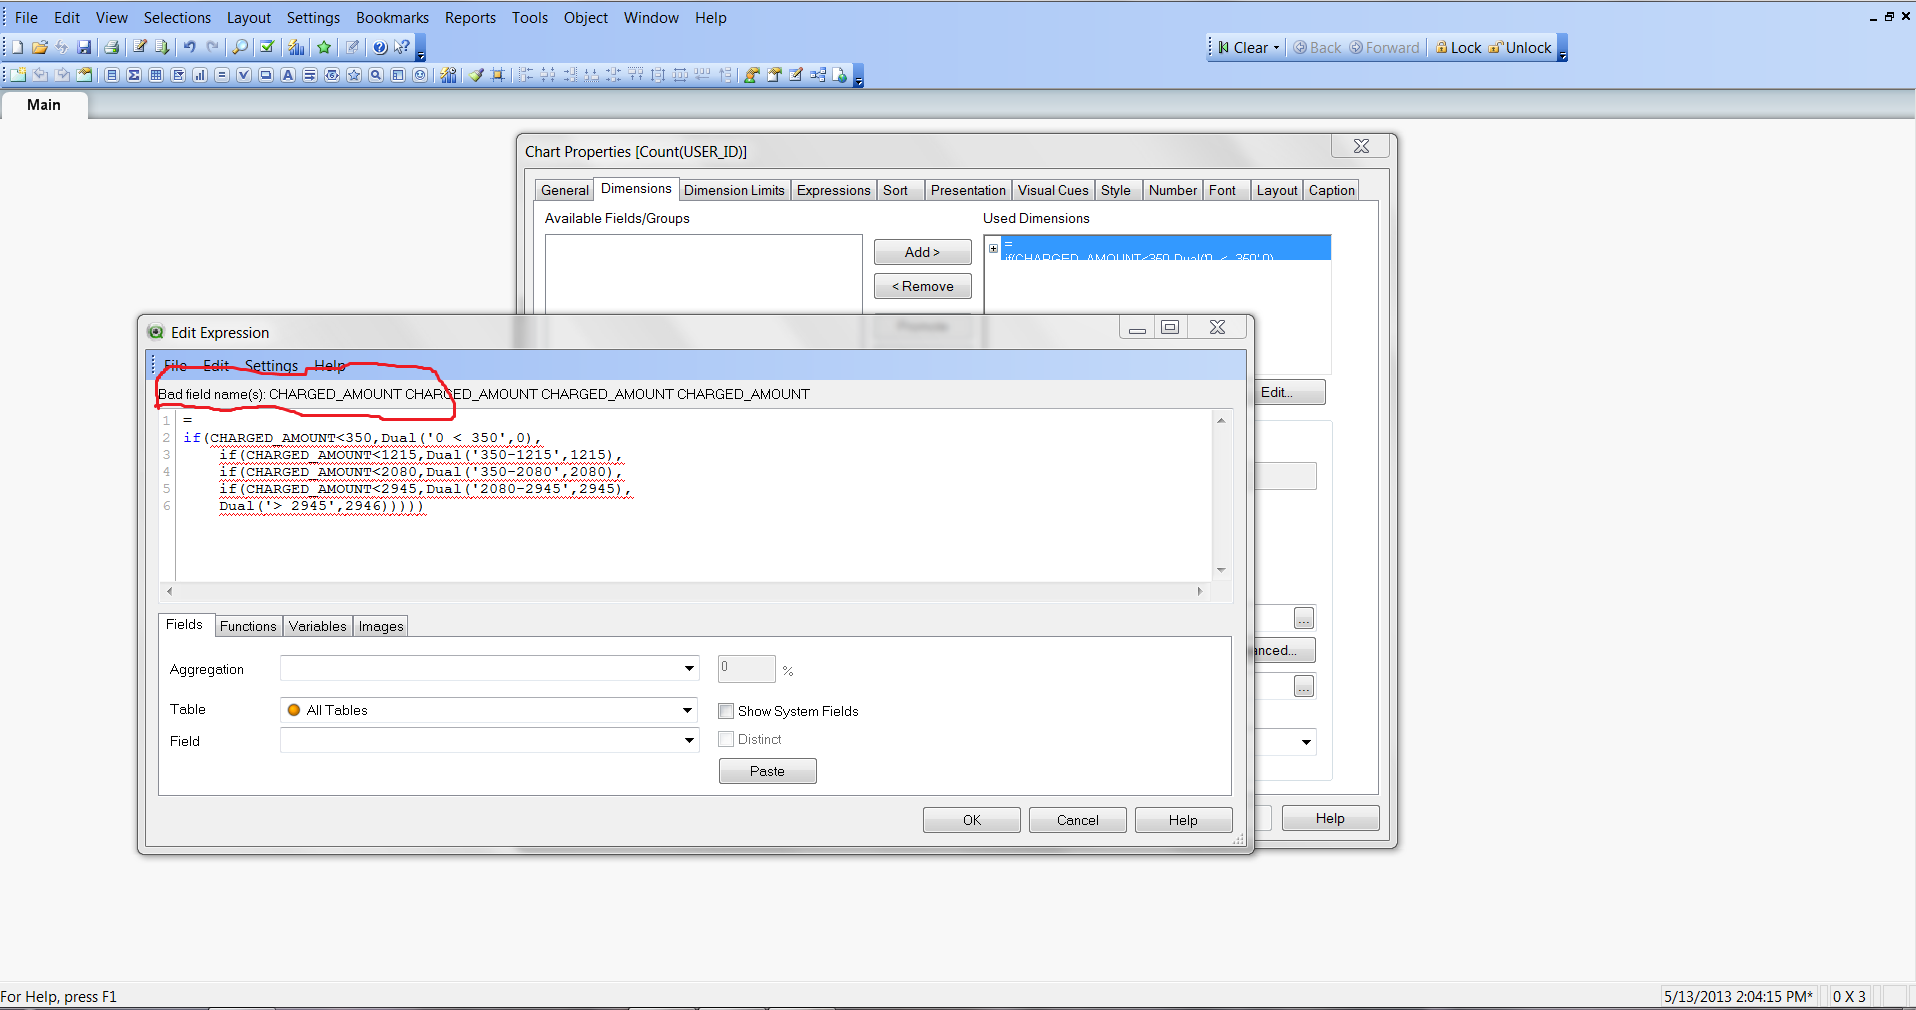
Thank you and looking forward for your help