Unlock a world of possibilities! Login now and discover the exclusive benefits awaiting you.
- Qlik Community
- :
- All Forums
- :
- QlikView App Dev
- :
- Re: How do I define the order to show bars from le...
- Subscribe to RSS Feed
- Mark Topic as New
- Mark Topic as Read
- Float this Topic for Current User
- Bookmark
- Subscribe
- Mute
- Printer Friendly Page
- Mark as New
- Bookmark
- Subscribe
- Mute
- Subscribe to RSS Feed
- Permalink
- Report Inappropriate Content
How do I define the order to show bars from left to right?
Hi all,
I like to accumulate a dimension based on the first expression, but when I make a bar graph always the first expression is on the left, however I would like to show the first expression on the right or otherwise I would like to choose what expression to use for accumulate dimensions...
I have this graph:
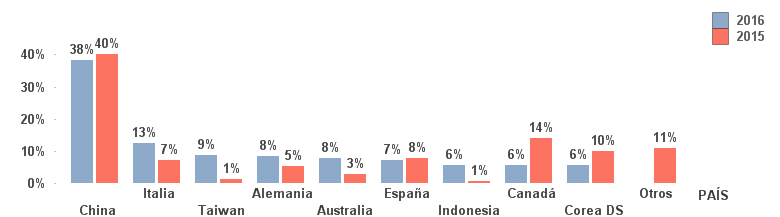
2016 is an expression and the graph only shows countries representing at least 5%... So... I want to put 2016 on the righ and maintain the color of the bar....
Please help me.
Regards,
Fernando
Accepted Solutions
- Mark as New
- Bookmark
- Subscribe
- Mute
- Subscribe to RSS Feed
- Permalink
- Report Inappropriate Content
I think you can do it just like this, using your current chart with the dimension limit and two expressions:
Create a new expression
=column(3)
and promote to the top. 2015 expression should be second and 2016 expression third
Then deselect 'bar' on display options for first expression.
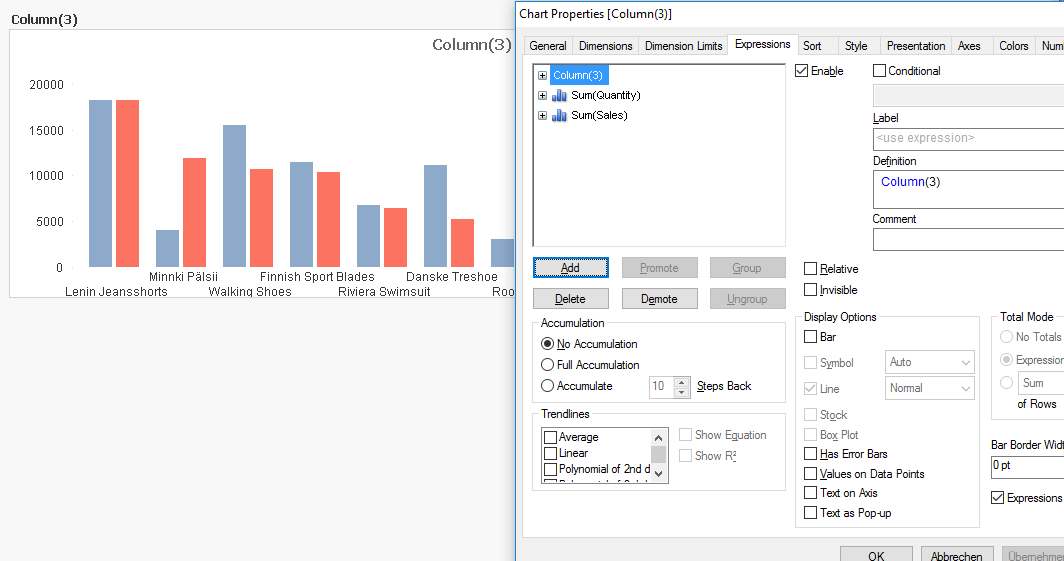
You'll see two bars, sorted descending by second bar and also dimension limited by second bar (i.e. first expression)
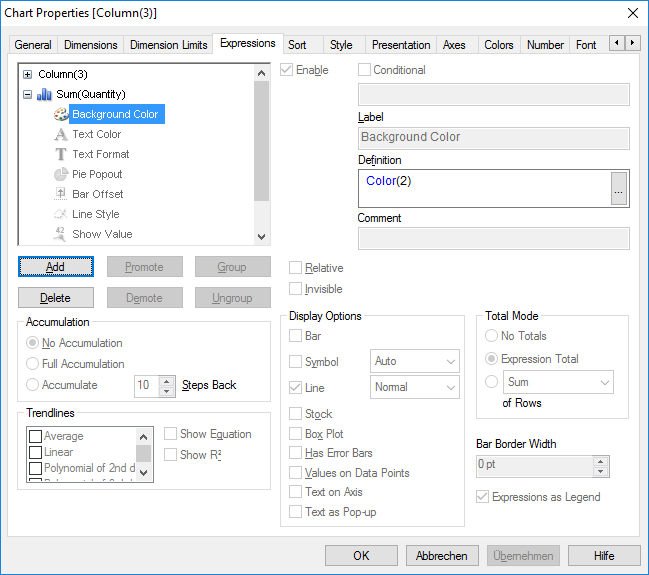
If you want to keep the colors, set background color attribute expressions for second and third expression:
=color(2)
=color(1)
Hope this helps,
Stefan
- Mark as New
- Bookmark
- Subscribe
- Mute
- Subscribe to RSS Feed
- Permalink
- Report Inappropriate Content
Hi Fernando,
can you upload an example QVW that shows the issue?
Andy
- Mark as New
- Bookmark
- Subscribe
- Mute
- Subscribe to RSS Feed
- Permalink
- Report Inappropriate Content
Here when you want to put limit QlikView for dafault use the first expression to restrict, but I would like to choose which expression to use...
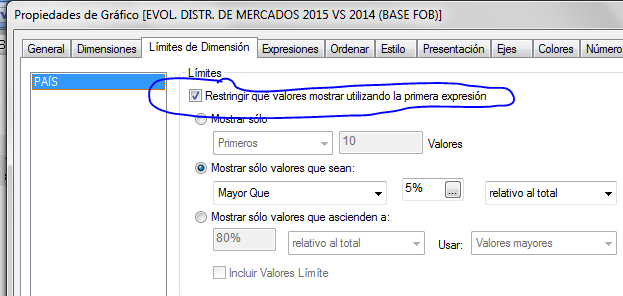
To QlikView the first expression is which is on the top....

- Mark as New
- Bookmark
- Subscribe
- Mute
- Subscribe to RSS Feed
- Permalink
- Report Inappropriate Content
But if I promote 2015 to the top I will change the condition to resctrict dimention and I don't want to do this... I want to restrict always by 2016's expression..
- Mark as New
- Bookmark
- Subscribe
- Mute
- Subscribe to RSS Feed
- Permalink
- Report Inappropriate Content
In the expression tab, click on the 2015 expression and click promote:

Is this what you mean?
Andy
- Mark as New
- Bookmark
- Subscribe
- Mute
- Subscribe to RSS Feed
- Permalink
- Report Inappropriate Content
No it is not... This change condition to restrict the dimention to "2015's expression"...
- Mark as New
- Bookmark
- Subscribe
- Mute
- Subscribe to RSS Feed
- Permalink
- Report Inappropriate Content
Hi Fernando...
Maybe You could use match in the dimention Country
match(PAIS, España,Italia,Indonesia, ...)
Silvia
- Mark as New
- Bookmark
- Subscribe
- Mute
- Subscribe to RSS Feed
- Permalink
- Report Inappropriate Content
Hi Fernando, you can switch the expressions order as said above and use another way to limit your dimension, like using a calculated dimension:
=Aggr(If(Sum(Sales)/Sum(TOTAL Sales)>0.05, DimensionField), DimensionField)
// In QV12 in can be done using set analisys in Aggr...but I didn't tested yet
In the 'Colors' tab (or using background expression) you can also set the color of each bar.
- Mark as New
- Bookmark
- Subscribe
- Mute
- Subscribe to RSS Feed
- Permalink
- Report Inappropriate Content
I think you can do it just like this, using your current chart with the dimension limit and two expressions:
Create a new expression
=column(3)
and promote to the top. 2015 expression should be second and 2016 expression third
Then deselect 'bar' on display options for first expression.
You'll see two bars, sorted descending by second bar and also dimension limited by second bar (i.e. first expression)
If you want to keep the colors, set background color attribute expressions for second and third expression:
=color(2)
=color(1)
Hope this helps,
Stefan
- Mark as New
- Bookmark
- Subscribe
- Mute
- Subscribe to RSS Feed
- Permalink
- Report Inappropriate Content
Swuehl,
Thank you so much!... This works perfectly!
Regards,
Fernando Toro