Unlock a world of possibilities! Login now and discover the exclusive benefits awaiting you.
Announcements
See why Qlik is a Leader in the 2024 Gartner® Magic Quadrant™ for Analytics & BI Platforms.
Download Now
- Qlik Community
- :
- All Forums
- :
- QlikView App Dev
- :
- Re: How do I display percentage on X axis ?
Options
- Subscribe to RSS Feed
- Mark Topic as New
- Mark Topic as Read
- Float this Topic for Current User
- Bookmark
- Subscribe
- Mute
- Printer Friendly Page
Turn on suggestions
Auto-suggest helps you quickly narrow down your search results by suggesting possible matches as you type.
Showing results for
Not applicable
2014-08-11
04:23 PM
- Mark as New
- Bookmark
- Subscribe
- Mute
- Subscribe to RSS Feed
- Permalink
- Report Inappropriate Content
How do I display percentage on X axis ?
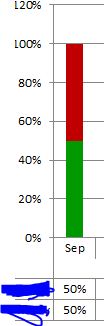
I know how to make the graph displayed in the photo. How do I put percentage out of 100% in the x axis?
I only have one expression so far : count ([1st pass])
1,323 Views
4 Replies
Anonymous
Not applicable
2014-08-11
04:33 PM
Author
- Mark as New
- Bookmark
- Subscribe
- Mute
- Subscribe to RSS Feed
- Permalink
- Report Inappropriate Content
if it is the value of the data point, then for the expression, in Display Options, try checking Text on Axis.
781 Views
Not applicable
2014-08-11
04:36 PM
Author
- Mark as New
- Bookmark
- Subscribe
- Mute
- Subscribe to RSS Feed
- Permalink
- Report Inappropriate Content
Hi,
Try with Chart Properties - tab Axes - Scale - /Static Min, Static Max , Step/.
Regards,
Venelin
781 Views
Not applicable
2014-08-11
04:40 PM
Author
- Mark as New
- Bookmark
- Subscribe
- Mute
- Subscribe to RSS Feed
- Permalink
- Report Inappropriate Content
what do i put there ? static min 100?
781 Views
Not applicable
2014-08-11
04:52 PM
Author
- Mark as New
- Bookmark
- Subscribe
- Mute
- Subscribe to RSS Feed
- Permalink
- Report Inappropriate Content
If the value is in percentage try with 1. But if your static min start with 100 % this will be your minimum value.