Unlock a world of possibilities! Login now and discover the exclusive benefits awaiting you.
- Qlik Community
- :
- All Forums
- :
- QlikView App Dev
- :
- Re: How do I get the first entry for each month fr...
- Subscribe to RSS Feed
- Mark Topic as New
- Mark Topic as Read
- Float this Topic for Current User
- Bookmark
- Subscribe
- Mute
- Printer Friendly Page
- Mark as New
- Bookmark
- Subscribe
- Mute
- Subscribe to RSS Feed
- Permalink
- Report Inappropriate Content
How do I get the first entry for each month from a date field?
My title probably isn't descriptive enough. There are a couple of reports run every month, and that data is dumped into a spreadsheet. That data has a date, model number, a "backlog count," and other fields. I need to make a chart that graphs that month's starting backlog total.
I'm sure it's something simple, and I'll hate myself once I get the answer, but my google-fu has failed me.
Thank you
- Mark as New
- Bookmark
- Subscribe
- Mute
- Subscribe to RSS Feed
- Permalink
- Report Inappropriate Content
Yes, and I cannot call that as first backlog as there are same dates for the backlog values, firstsortedvalue function will return null if there is more than one value of expression share lowest sort order. So i have used January as the Month and in that month picking up the highest number grouping by Model using Aggr function.
- Mark as New
- Bookmark
- Subscribe
- Mute
- Subscribe to RSS Feed
- Permalink
- Report Inappropriate Content
Ok, I think I'm getting it now. I'm not super-clear on how Aggr and FirstSortedValue interact. Does FSV select based on the first or second value in Aggr? I feel like I need to understand the order that Qlikview goes through things in order to construct my expressions properly. Is this correct:
First the dimension sorts out values for Date into "chunks" of Dates. Then those chunks are sent to the expression. The expression runs different functions on the data associated with those chunks of Dates. Aggr allows you to perform a different aggregation, then pair it with the value for that particular aggregation. Essentially condensing data so that there is one line per Date, which allows you to use FirstSortedValue. FirstSortedValue returns the number associated with the first Date within the Aggr, which is then plotted on the graph.
The data would go something like this?
1/1/16,A,25
1/1/16,B,22
1/8/16,A,15
1/8/16,B,17
2/4/16,A,10
2/4/16,B,11
2/8/16,A,5
2/8/16,B,7
Then broken into months by the dimension:
1/1/16,A,25
1/1/16,B,22
1/8/16,A,15
1/8/16,B,17
_________
2/4/16,A,10
2/4/16,B,11
2/8/16,A,5
2/8/16,B,7
_________
march stuff
_________
Then condensed by Aggr:
1/1/16,47
1/8/16,32
________
2/4/16,21
2/8/16,12
________
Then further filtered by FirstSortedValue:
1/1/16,47
________
2/4/16,21
________
Then it graphs that data once there is one value for each chunk of data set by the dimension.
Unless this is all wrong?
Thank you
- Mark as New
- Bookmark
- Subscribe
- Mute
- Subscribe to RSS Feed
- Permalink
- Report Inappropriate Content
That's correct. For more explanation on on Aggr and Firstsortedvalue refer reference manual which has detailed information.
V.
- Mark as New
- Bookmark
- Subscribe
- Mute
- Subscribe to RSS Feed
- Permalink
- Report Inappropriate Content
Thank you for all of the responses, but I'm still having problems. FirstSortedValue is giving me the first sorted backlog value rather than the first date value. How would I have to organize the expression to get it to sort by date rather than the sum of the backlog?
- Mark as New
- Bookmark
- Subscribe
- Mute
- Subscribe to RSS Feed
- Permalink
- Report Inappropriate Content
Sorry about that, can I know what exactly the output you are looking for from the dates and backlog.If you want to display by dates, remove the Month dimension and add date as dimension and use this in your expr and let me know.
Expr: Firstsortedvalue( Aggr(Sum(backlog),date), -Aggr(sum(backlog), date))
- Mark as New
- Bookmark
- Subscribe
- Mute
- Subscribe to RSS Feed
- Permalink
- Report Inappropriate Content
I mean, it mostly works. January, April, and October are correct, but that's by coincidence. Management wants stats showing the backlog at the start of every month, but my data is based on reports that are run weekly. So I need to run sum(backlog) on the first week in every month. 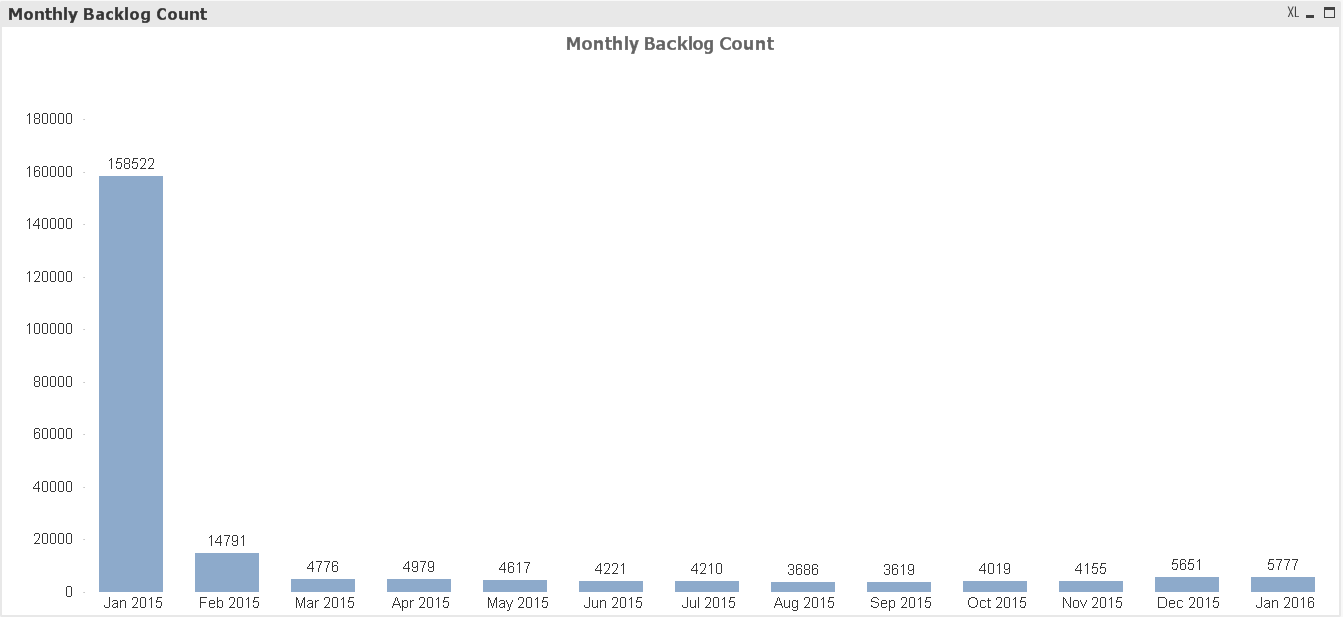
- Mark as New
- Bookmark
- Subscribe
- Mute
- Subscribe to RSS Feed
- Permalink
- Report Inappropriate Content
Did you try that expression i have sent you in my last message? Did it give you any correct results. The data I have is only few rows, can you send me this sample app i can work on if possible ?
- Mark as New
- Bookmark
- Subscribe
- Mute
- Subscribe to RSS Feed
- Permalink
- Report Inappropriate Content
Here's a sample app that shows the problem I'm trying to handle. The values displayed by Chart 2 should match the first values for each month in Chart 1, instead of the highest value for each month.
- Mark as New
- Bookmark
- Subscribe
- Mute
- Subscribe to RSS Feed
- Permalink
- Report Inappropriate Content
Can you try this with Dimension as Monthyear.
LOAD * ,
Month(report_date) & '' & Year(report_date) AS MonthYear
INLINE [
report_date,model,backlog
........
];
Expr:
= Sum(Aggr(FirstSortedValue(backlog, report_date), model, MonthYear))
- Mark as New
- Bookmark
- Subscribe
- Mute
- Subscribe to RSS Feed
- Permalink
- Report Inappropriate Content
And in the sort tab uncheck everything and check Load Order check box.