Unlock a world of possibilities! Login now and discover the exclusive benefits awaiting you.
- Qlik Community
- :
- All Forums
- :
- QlikView App Dev
- :
- Re: How to analysis using more and selected dimens...
- Subscribe to RSS Feed
- Mark Topic as New
- Mark Topic as Read
- Float this Topic for Current User
- Bookmark
- Subscribe
- Mute
- Printer Friendly Page
- Mark as New
- Bookmark
- Subscribe
- Mute
- Subscribe to RSS Feed
- Permalink
- Report Inappropriate Content
How to analysis using more and selected dimensions?
Hi All,
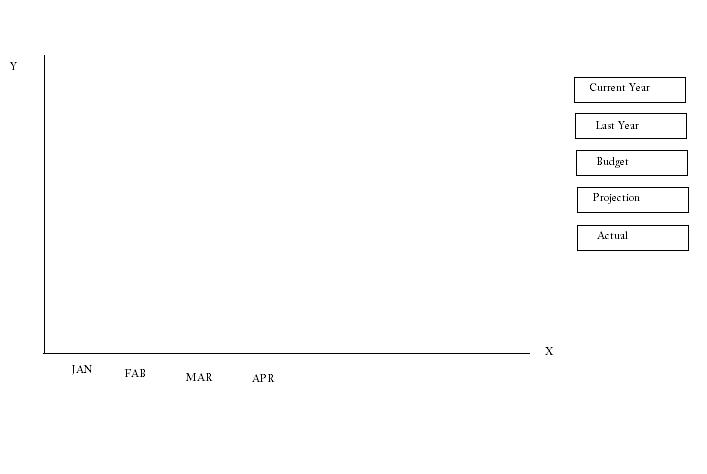
I want to make a table looks like below, where the X axes always in months. I need dimensions to appear or show on the chart according to my selection as I want to analysis I'll be selecting the dimensions.
Eg: If I want to analysis Budget + Projection I'll be selecting only those to and it should appear month wise
same as that I'll be selecting different, different dimension according to my need.
can I do this analysing in qlikview or is there any other ways to do thing like this?
Please help me on this... Thanks in advance..!!! Andrea GhirardelloJuan Gerardo Cabeza LuqueMarcus Sommer
- Tags:
- analysis
- « Previous Replies
-
- 1
- 2
- Next Replies »
Accepted Solutions
- Mark as New
- Bookmark
- Subscribe
- Mute
- Subscribe to RSS Feed
- Permalink
- Report Inappropriate Content
You can do Sushil Kumar solution or work with buttons-actions on variables and conditional show. Whatever you feel most cofortable with will be the best.
I attached a button-action variable example.
Vegar Lie Arntsen
QlikView Developer
Blog: http://aqlik.se
Qlik Community MVP
- Mark as New
- Bookmark
- Subscribe
- Mute
- Subscribe to RSS Feed
- Permalink
- Report Inappropriate Content
Hi,
It can be easily done by creating the desired expressions and hiding or unhiding based on the selection in a listbox..
You can create a inline load with name specified by you...
and then for each expression in enable condition . you can put condition based on the selection of listbox.
=getfieldselection(name of Listbox)='Budget' for Budget expression
HTH
Sushil
- Mark as New
- Bookmark
- Subscribe
- Mute
- Subscribe to RSS Feed
- Permalink
- Report Inappropriate Content
Hi,
Thanks for the replay! do you have any sample .qvd
where I can go through and get an idea
regards,
MJ
- Mark as New
- Bookmark
- Subscribe
- Mute
- Subscribe to RSS Feed
- Permalink
- Report Inappropriate Content
You can do Sushil Kumar solution or work with buttons-actions on variables and conditional show. Whatever you feel most cofortable with will be the best.
I attached a button-action variable example.
Vegar Lie Arntsen
QlikView Developer
Blog: http://aqlik.se
Qlik Community MVP
- Mark as New
- Bookmark
- Subscribe
- Mute
- Subscribe to RSS Feed
- Permalink
- Report Inappropriate Content
- Mark as New
- Bookmark
- Subscribe
- Mute
- Subscribe to RSS Feed
- Permalink
- Report Inappropriate Content
Hi,
I think you should get good results by using conditional dimensions and expressions.
See the official What's new in QlikView11.qvw (tab reports) for details.
Here you can download it and get detailed info about these features:
http://eu-a.demo.qlik.com/detail.aspx?appName=Whats%20New%20in%20QlikView11.qvw
Hope this helps,
Andrea
- Mark as New
- Bookmark
- Subscribe
- Mute
- Subscribe to RSS Feed
- Permalink
- Report Inappropriate Content
Hi,
can you please emplane below query...
set v.gui.previousyear = 0;
set v.gui.currentyear = -1;
set v.gui.projection = 0;
set v.gui.budget = -1;
Transactions:
Load
date(%date) as Date,
year(%date) as Year,
Month(%date) as Month,
Pick(Ceil(3*Rand1),'A','B','C') as Dim1,
Pick(Ceil(6*Rand1),'a','b','c','d','e','f') as Dim2,
Pick(Ceil(3*Rand()),'X','Y','Z') as Dim3,
Round(1000*Rand()*Rand()*Rand1) as Projection,
Round(1000*Rand()*Rand()*Rand()*Rand1) as Budgt;
Load
today() - IterNo()*recno() as %date,
Rand() as Rand1,
IterNo() as TransLineID,
RecNo() as TransID
Autogenerate 10000
While Rand()<=0.5 or IterNo()=1;
Comment Field Dim1 With "This is a field comment";
- Mark as New
- Bookmark
- Subscribe
- Mute
- Subscribe to RSS Feed
- Permalink
- Report Inappropriate Content
You should not look so much at the script. It is basically part of the code that is generated when pressing ctrl Q Q in the editor.
The variables are part of the solution.
set v.gui.previousyear = 0;
set v.gui.currentyear = -1;
set v.gui.projection = 0;
set v.gui.budget = -1;
They are created in the script, but modified as you click the buttons to the right. The expressions are dependent on the value of the variables. Take a look at the conditional show for each expression.
Qlik Community MVP
- Mark as New
- Bookmark
- Subscribe
- Mute
- Subscribe to RSS Feed
- Permalink
- Report Inappropriate Content
Thank you so much! but my concern is what is happening out of pick and rand and how this works can you please explain, this will be much useful
- Mark as New
- Bookmark
- Subscribe
- Mute
- Subscribe to RSS Feed
- Permalink
- Report Inappropriate Content
Hi,
Rand() is a Random number generator function, for each iteration it will give different number between 0 and 1.
Pick(Ceil(3*Rand1),'A','B','C') - Pick() will pick the value based on the expression, if Ceil(3*Rand1) returns 1 it picks A, if 2 then B, if 3 then C.
Refer Qlikview help file for more details.
Hope this helps you.
Regards,
Jagan.
- « Previous Replies
-
- 1
- 2
- Next Replies »