Unlock a world of possibilities! Login now and discover the exclusive benefits awaiting you.
- Qlik Community
- :
- All Forums
- :
- QlikView App Dev
- :
- Re: How to calculate an average of three cheapest ...
- Subscribe to RSS Feed
- Mark Topic as New
- Mark Topic as Read
- Float this Topic for Current User
- Bookmark
- Subscribe
- Mute
- Printer Friendly Page
- Mark as New
- Bookmark
- Subscribe
- Mute
- Subscribe to RSS Feed
- Permalink
- Report Inappropriate Content
How to calculate an average of three cheapest / most expensive products?
Good Morning,
I have a question of how to calculate the average of the 3 cheapest products in a list / respectively the three most expensive products in a list products with prices at a certain Date.
Example:
| Dat | Product | Price |
| 1.2.18 | A | 10,00 |
| 1.2.18 | B | 9,78 |
| 1.2.18 | C | 9,90 |
| 1.2.18 | D | 7,55 |
| 1.2.18 | E | 5,54 |
| 1.2.18 | F | 6,70 |
| 1.2.18 | G | 3,30 |
| 1.2.18 | H | 2,90 |
| 1.2.18 | I | 2,90 |
| 1.2.18 | J | 9,97 |
| 1.2.18 | K | 9,97 |
| 1.2.18 | L | 9,97 |
| 1.2.18 | M | 2,31 |
| 1.2.18 | N | 2,31 |
| 1.2.18 | O | 2,31 |
| 1.2.18 | P | 0,98 |
| 1.2.18 | Q | 0,99 |
As a result for the "average of the 3 most expensive" I would like to see: Average = 9,98
| Dat | Product | Price |
| 1.2.18 | A | 10,00 |
| 1.2.18 | J | 9,97 |
| 1.2.18 | K | 9,97 |
(A+J+K )/3= 9,98
Remarks:
a) Although the Price of product "L" is the same as "J" and "K", it is not taken into account, because I only Need the first three cheapest products.
c) In case there are only two products in the list, (e.g. at Date "Dat 1.3.18" only Product A and B) the calculation should be A+B/2.
I have tried it in many ways, but without acceaptable results.
Thanks for your help!
- Mark as New
- Bookmark
- Subscribe
- Mute
- Subscribe to RSS Feed
- Permalink
- Report Inappropriate Content
may be try like
Correction:
= Avg(Aggr(IF(Aggr(Rank(Sum(Price),4), Product)<=3, Sum(Price)), Product))
If date changes use this in aggr
= Avg(Aggr(IF(Aggr(Rank(Sum(Price),4), Dat, Product)<=3, Sum(Price)), Dat,Product))
- Mark as New
- Bookmark
- Subscribe
- Mute
- Subscribe to RSS Feed
- Permalink
- Report Inappropriate Content
Another way is using Pivot table:
CheapestPrice:
LOAD *, Date(Date#(Dat, 'M.D.YY')) AS DateFormatted INLINE [
Dat, DatID, Price, Product
1.2.18, 43102, 0.98, P
1.2.18, 43102, 0.99, Q
1.2.18, 43102, 2.31, M
1.2.18, 43102, 2.31, N
1.2.18, 43102, 2.31, O
1.2.18, 43102, 2.90, H
1.2.18, 43102, 2.90, I
1.2.18, 43102, 3.30, G
1.2.18, 43102, 5.54, E
1.2.18, 43102, 6.70, F
1.2.18, 43102, 7.55, D
1.2.18, 43102, 9.78, B
1.3.18, 43102, 9.90, C
1.3.18, 43102, 9.97, J
1.2.18, 43102, 9.97, K
1.2.18, 43102, 9.97, L
1.2.18, 43102, 10.00, A
];
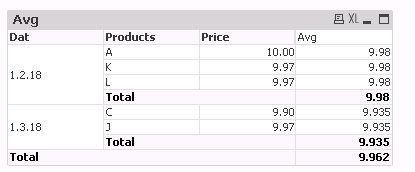
using Pivot table add
Dim:
Dat
= Aggr(IF(Aggr(Rank(Sum(Price),4), Dat, Product)<=3, Product), Product)
Price
Expr:
= Avg(TOTAL <Dat> Aggr(IF(Aggr(Rank(Sum(Price),4), Dat, Product)<=3, Sum(Price)/Count(Price)), Dat,Product))
you will see like below:
- Mark as New
- Bookmark
- Subscribe
- Mute
- Subscribe to RSS Feed
- Permalink
- Report Inappropriate Content
Many thanks! Great!
Do you have a suggestion for the cheapest 3 products at a certain date? Something like "-"rank ?
- Mark as New
- Bookmark
- Subscribe
- Mute
- Subscribe to RSS Feed
- Permalink
- Report Inappropriate Content
Great! Really good idea. Many thanks!!
Do you have a suggestion for the lowest 3 Prices as well?
- Mark as New
- Bookmark
- Subscribe
- Mute
- Subscribe to RSS Feed
- Permalink
- Report Inappropriate Content
Yes just use - before the sum like
Dim:
Dat
= Aggr(IF(Aggr(Rank(-Sum(Price),4), Dat, Product)<=3, Product), Product)
Price
Expr:
= Avg(TOTAL <Dat> Aggr(IF(Aggr(Rank(-Sum(Price),4), Dat, Product)<=3, Sum(Price)/Count(Price)), Dat,Product))
- Mark as New
- Bookmark
- Subscribe
- Mute
- Subscribe to RSS Feed
- Permalink
- Report Inappropriate Content
Good way to identify lowest 3 avg.
- Mark as New
- Bookmark
- Subscribe
- Mute
- Subscribe to RSS Feed
- Permalink
- Report Inappropriate Content
Many thanks! Very helpful.
- Mark as New
- Bookmark
- Subscribe
- Mute
- Subscribe to RSS Feed
- Permalink
- Report Inappropriate Content
Can you close the thread accordingly if it answered your query.