Unlock a world of possibilities! Login now and discover the exclusive benefits awaiting you.
- Qlik Community
- :
- All Forums
- :
- QlikView App Dev
- :
- How to calculate cumulative count in chart
- Subscribe to RSS Feed
- Mark Topic as New
- Mark Topic as Read
- Float this Topic for Current User
- Bookmark
- Subscribe
- Mute
- Printer Friendly Page
- Mark as New
- Bookmark
- Subscribe
- Mute
- Subscribe to RSS Feed
- Permalink
- Report Inappropriate Content
How to calculate cumulative count in chart
Hello,
I have been dogged by this problem of counting cumulative of a distinct_row_key for quite some time and I hope someone smarter than me can help me out.
Here is my issue. I have a number of dimensions, namely Year and Month. I have a chart that shows count per months and also displays a total cumulative count for the selected time period. The thing is that my formula to calculate cumulative count is not showing the right result - it seems to not count the distinct_row_key that have not been selected by the selection criteria. The odd thing is that when I put the same formula in a simple text box the summary is correct. Additionally, when I choose all Year and Month selections until the current point - I also get the right answer. This is why I believe that my current formula is simply not counting distinct_row_key that have not been selected.
The formula I am using is as follows: SUM(AGGR(Count({1 <[market_data]={'Market'},[sdk_syncs]={">0"},date_week_key={"<=201218"}>} distinct_row_key),distinct_row_key)).
In addition I am using full accumulation.
Thanks!
- Mark as New
- Bookmark
- Subscribe
- Mute
- Subscribe to RSS Feed
- Permalink
- Report Inappropriate Content
Try adding the set modifier to the sum too:
SUM({1 <[market_data]={'Market'},[sdk_syncs]={">0"},date_week_key={"<=201218"}>}
AGGR(Count({1 <[market_data]={'Market'},[sdk_syncs]={">0"},date_week_key={"<=201218"}>} distinct_row_key),distinct_row_key))
talk is cheap, supply exceeds demand
- Mark as New
- Bookmark
- Subscribe
- Mute
- Subscribe to RSS Feed
- Permalink
- Report Inappropriate Content
Hello,
I have had problems replying until now.
Your suggestion almost worked. The problem is now my chart is showing dates that have not been selected as below:
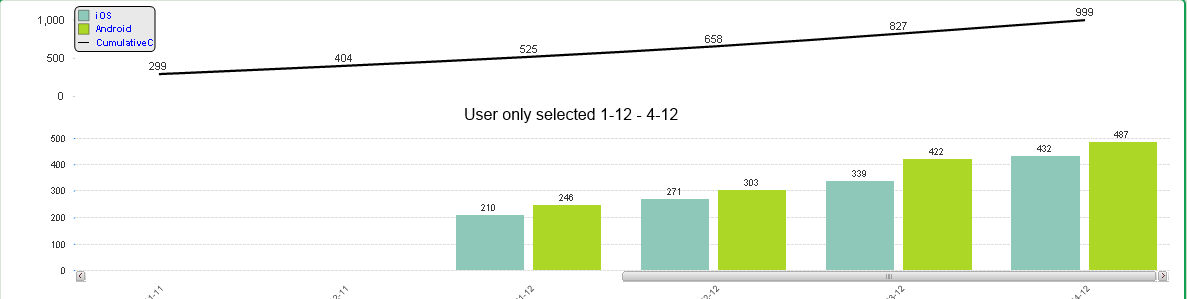
Any ideas how to get the results I need with the changes to the formula you suggested - but to hide the non-selected portion of the graph?
Thanks!