Unlock a world of possibilities! Login now and discover the exclusive benefits awaiting you.
- Qlik Community
- :
- All Forums
- :
- QlikView App Dev
- :
- How to change the format of the Expression's text?
- Subscribe to RSS Feed
- Mark Topic as New
- Mark Topic as Read
- Float this Topic for Current User
- Bookmark
- Subscribe
- Mute
- Printer Friendly Page
- Mark as New
- Bookmark
- Subscribe
- Mute
- Subscribe to RSS Feed
- Permalink
- Report Inappropriate Content
How to change the format of the Expression's text?
Hi,
I found there are some properties in expression of the pivot table:Background Color,Text Color, Text Format and so on.
I know how to set color like Red(), but how to make the Text be bold? Which function I should use?
Thanks.
- « Previous Replies
-
- 1
- 2
- Next Replies »
- Mark as New
- Bookmark
- Subscribe
- Mute
- Subscribe to RSS Feed
- Permalink
- Report Inappropriate Content
It's pretty simple:
Textformat: '<B>'
don't forget to also use single quotes!! it won't work without them
- Mark as New
- Bookmark
- Subscribe
- Mute
- Subscribe to RSS Feed
- Permalink
- Report Inappropriate Content
Hi,
As mentioned by Anita, you can use '<b> <i> <u>' for Bold, Italic and Underlined. You need to specify these settings under Text Format option under the expression. This can be conditional and you can control the format for specific cells. I am attaching the screenshot for you reference.

Also, you can use the Custom Format for Pivot Table by right clicking on the Pivot Table. You can control the formatting here. But you need enable the Custom formatting from User Preference Settings. I have attached the screenshot for you reference.

I hope this helps!
Cheers - DV
- Mark as New
- Bookmark
- Subscribe
- Mute
- Subscribe to RSS Feed
- Permalink
- Report Inappropriate Content
Thanks, it works well. Do you know how to set the font size also?
- Mark as New
- Bookmark
- Subscribe
- Mute
- Subscribe to RSS Feed
- Permalink
- Report Inappropriate Content
properties->font tab
se your font here
- Mark as New
- Bookmark
- Subscribe
- Mute
- Subscribe to RSS Feed
- Permalink
- Report Inappropriate Content
How to align the text to centre using text format option of the expression?
- Mark as New
- Bookmark
- Subscribe
- Mute
- Subscribe to RSS Feed
- Permalink
- Report Inappropriate Content
Few months back, I've made a video on all the attributes of chart expression.
I hope this helps!
Cheers,
DV
- Mark as New
- Bookmark
- Subscribe
- Mute
- Subscribe to RSS Feed
- Permalink
- Report Inappropriate Content
Hi DV,
It still doesnt help as '<center>' option doesnt work???
- Mark as New
- Bookmark
- Subscribe
- Mute
- Subscribe to RSS Feed
- Permalink
- Report Inappropriate Content
I don't think it support all the HTML tags. Which chart object are you using? Have you considered using "Alignment" under "Presentation" tab? If you need format a specific field value then you use something as below :
Repeat(CHR(32), 10) & COUNT(CustomerKey) & Repeat(CHR(32), 10)
This is not a clean solution but it still works. Please provide sample app if this doesn't help.
Cheers,
DV
- Mark as New
- Bookmark
- Subscribe
- Mute
- Subscribe to RSS Feed
- Permalink
- Report Inappropriate Content
Hi DV,
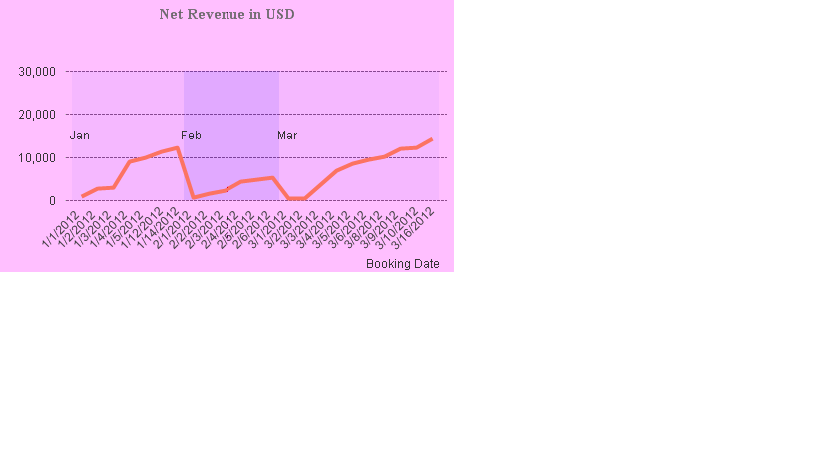
This also doesnt work . i have a combo chart wit bar and line . Bar represent the months and line is mapped to dates.
There is no alignment option under presentation tab and month is an expression which has 'plot values inside segmnets' ticked. if u can see the months are left aligned

- « Previous Replies
-
- 1
- 2
- Next Replies »