Unlock a world of possibilities! Login now and discover the exclusive benefits awaiting you.
- Qlik Community
- :
- All Forums
- :
- QlikView App Dev
- :
- Re: How to create a chart to divide avg data ?
- Subscribe to RSS Feed
- Mark Topic as New
- Mark Topic as Read
- Float this Topic for Current User
- Bookmark
- Subscribe
- Mute
- Printer Friendly Page
- Mark as New
- Bookmark
- Subscribe
- Mute
- Subscribe to RSS Feed
- Permalink
- Report Inappropriate Content
How to create a chart to divide avg data ?
Hi guys, i need for your help please.
In the excel file attacched you can see tree columns, the firts one with time, the second with login, and th ethird with avg time calculated from a pivot table inside my qlikview project.
Now i have to create a chart that show me how many login are inside tre range of avg time for each days
i.e.
Suppose that i define tree range :
from 0 to 00:10:00
from 00:10:01 to 00:20:00
from 00:20:01 to max
I need to rappresent how many login are inside first range, second and finally, the last...
i hope is almost clear.
Here you have the final table in the first sheet of excel file, but this table is a result of avg formula based on the data tha you can see on the second sheet.
Thank you bye.
- Mark as New
- Bookmark
- Subscribe
- Mute
- Subscribe to RSS Feed
- Permalink
- Report Inappropriate Content
I think you are looking to create buckets here, try this
- Mark as New
- Bookmark
- Subscribe
- Mute
- Subscribe to RSS Feed
- Permalink
- Report Inappropriate Content
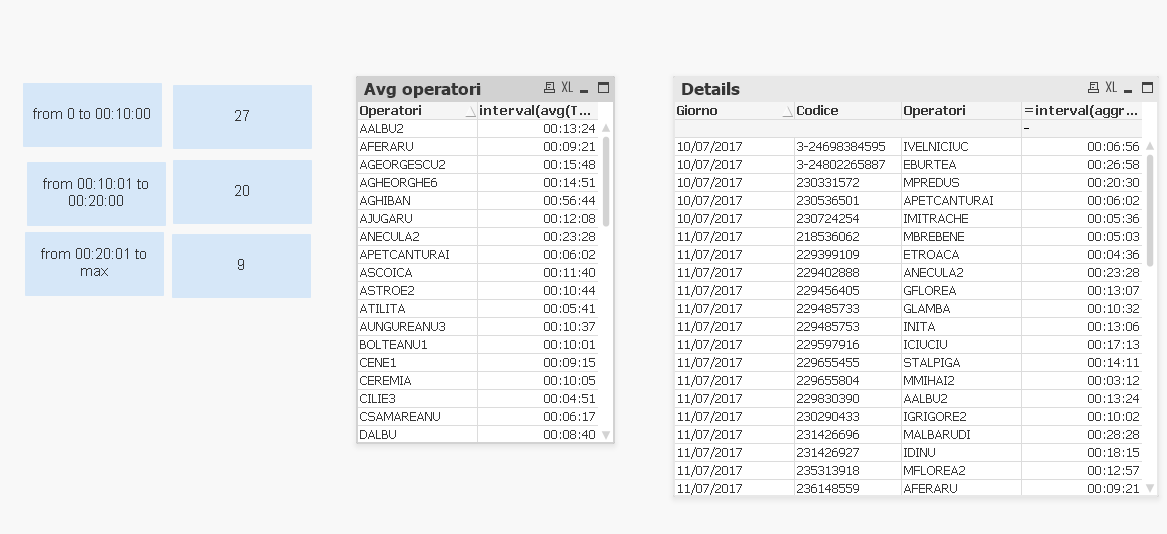
In text boxs, maybe you can do this :
1. Create a variable V_tempo_medio
interval(aggr(avg(Tempo_medio),Operatori ) ,'hh:mm:ss')
2. Use it in text boxs with following expressions for count operators
=sum(if($(V_tempo_medio) <= MakeTime(0,10,0) and $(V_tempo_medio)>=MakeTime(0,0,0) ,1,0))
=sum(if($(V_tempo_medio) <= MakeTime(0,20,0) and $(V_tempo_medio)>MakeTime(0,10,1) ,1,0))
=sum(if($(V_tempo_medio)>MakeTime(0,20,1) ,1,0))

Is it what you are trying to achieve or not ?
- Mark as New
- Bookmark
- Subscribe
- Mute
- Subscribe to RSS Feed
- Permalink
- Report Inappropriate Content
Hi Alessandro.
I don't see Login in Your Attached File.
However I load 2nd Sheet assuming [Codice esigenza] is Login.
You can change Expression as You need.
DIMENSIONS :
Giorno
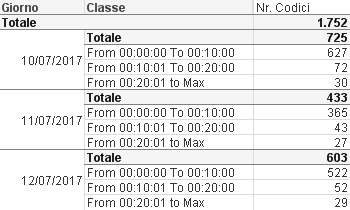
=Aggr(If(Num([Tempo medio di lavorazione]) >= 0 and Num([Tempo medio di lavorazione]) <= 10/1440,'From 00:00:00 To 00:10:00',
If(Num([Tempo medio di lavorazione]) > 10/1440 and Num([Tempo medio di lavorazione]) <= 20/1440,'From 00:10:01 To 00:20:00'
,'From 00:20:01 to Max')),Giorno,[Tempo medio di lavorazione])
EXPRESSION :
Count(DISTINCT [Codice esigenza])

Regards,
Antonio
- Mark as New
- Bookmark
- Subscribe
- Mute
- Subscribe to RSS Feed
- Permalink
- Report Inappropriate Content
it ssems to be near the goal.....but, the login column is named Operatori in the second sheet and i need to divide in range the avg tempo medio lavorazione for each login.
- Mark as New
- Bookmark
- Subscribe
- Mute
- Subscribe to RSS Feed
- Permalink
- Report Inappropriate Content
Antonio riscrivo in italiano per maggiore comprensione....si dovrebbe essere vicino al mio obbiettivo la tua dimensione, però non so se va ancora bene utilizzando la colonna operatori (che sarebbe la login nel mio esempio, scusa non lo avevo specificato).
Io dovrei dividere in fasce come tu mi hai indicato, però prima devo fare la media dei tempi medi per login e poi dividere in fasce e poi contarli.
spero di essere stato più chiaro.
Grazie,.
P.S.
Ho provato questa e sembra funzionare, però non sono mica sicuro che sia corretta :
=Aggr(If(Num((aggr(avg(Tempo Lavorazione),Operatore))) >= 0 and Num((aggr(avg(Tempo Lavorazione),tlo_login ))) <= 10/1440,'From 00:00:00 To 00:10:00',
If(Num((aggr(avg(Tempo Lavorazione),tlo_login ))) > 10/1440 and Num((aggr(avg(Tempo Lavorazione),tlo_login ))) <= 20/1440,'From 00:10:01 To 00:20:00'
,'From 00:20:01 to Max')),Giorno,Operatore)
- Mark as New
- Bookmark
- Subscribe
- Mute
- Subscribe to RSS Feed
- Permalink
- Report Inappropriate Content
Prova questa sui tuoi dati
=Aggr(If(Avg([Tempo medio di lavorazione]) >= 0 and Avg([Tempo medio di lavorazione]) <= 10/1440,'From 00:00:00 To 00:10:00',
If(Avg([Tempo medio di lavorazione]) > 10/1440 and Avg([Tempo medio di lavorazione]) <= 20/1440,'From 00:10:01 To 00:20:00'
,'From 00:20:01 to Max')),Giorno,Operatori)
Ovviamente adegua l' espressione a 'Operatori'