Unlock a world of possibilities! Login now and discover the exclusive benefits awaiting you.
- Qlik Community
- :
- All Forums
- :
- QlikView App Dev
- :
- Re: How to create report by row instead of by colu...
- Subscribe to RSS Feed
- Mark Topic as New
- Mark Topic as Read
- Float this Topic for Current User
- Bookmark
- Subscribe
- Mute
- Printer Friendly Page
- Mark as New
- Bookmark
- Subscribe
- Mute
- Subscribe to RSS Feed
- Permalink
- Report Inappropriate Content
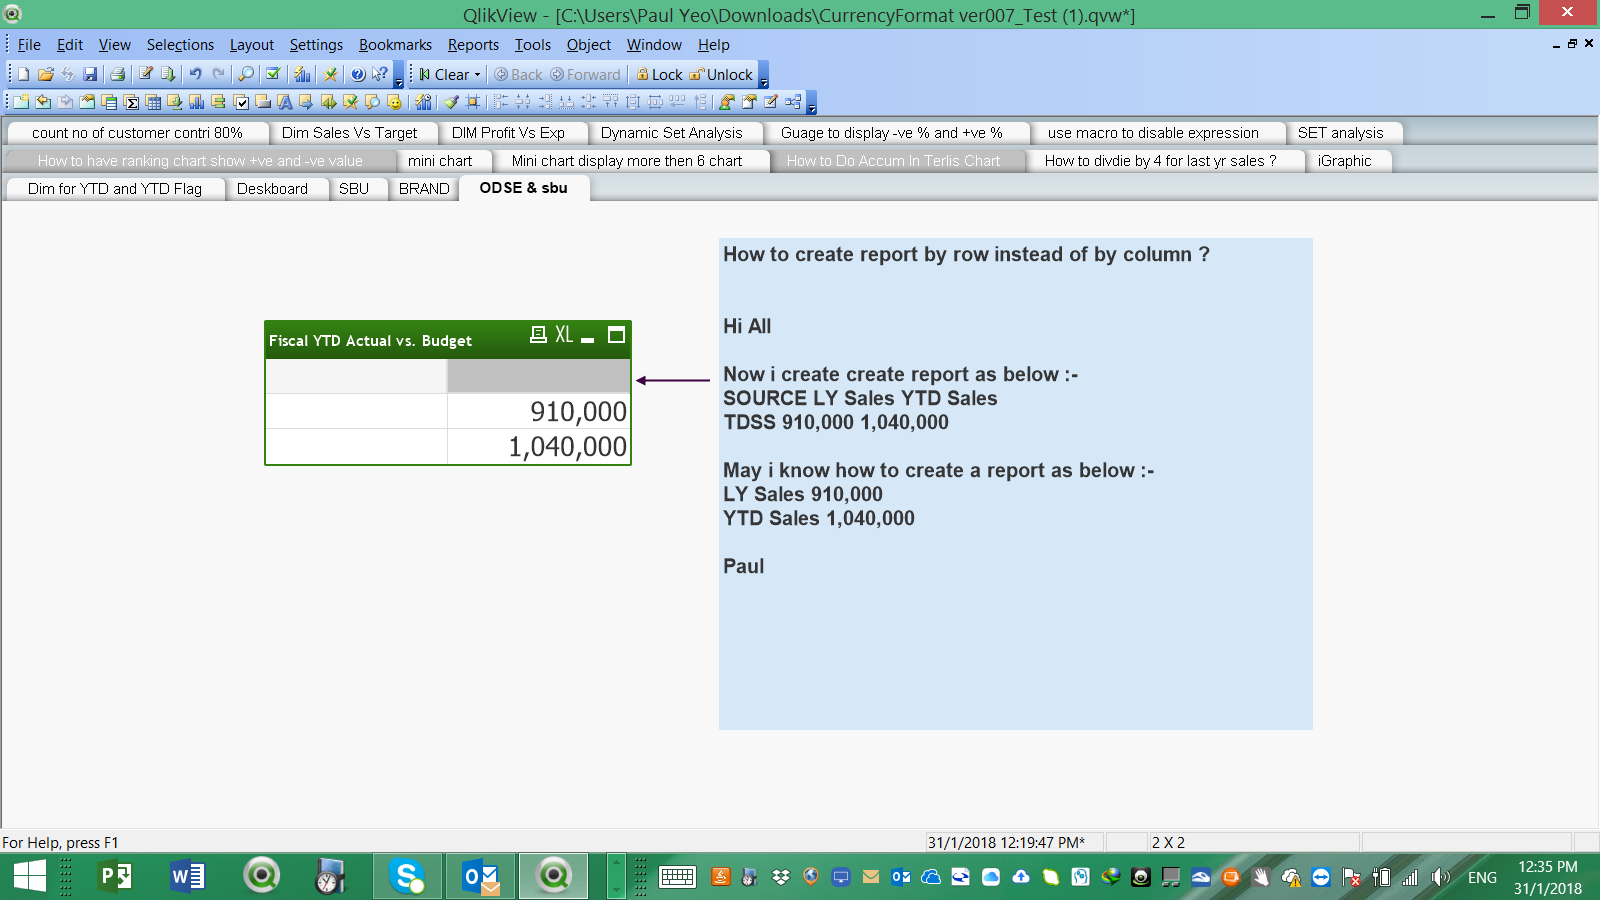
How to create report by row instead of by column ?
Hi All
Now i create create report as below :-
SOURCE LY Sales YTD Sales
TDSS 910,000 1,040,000
May i know how to create a report as below :-
LY Sales 910,000
YTD Sales 1,040,000
Paul
- Tags:
- qlikview_scripting
- « Previous Replies
-
- 1
- 2
- Next Replies »
Accepted Solutions
- Mark as New
- Bookmark
- Subscribe
- Mute
- Subscribe to RSS Feed
- Permalink
- Report Inappropriate Content
- Mark as New
- Bookmark
- Subscribe
- Mute
- Subscribe to RSS Feed
- Permalink
- Report Inappropriate Content
Hi Yeo Poh Sai,
Have a look at the attached file.
- Mark as New
- Bookmark
- Subscribe
- Mute
- Subscribe to RSS Feed
- Permalink
- Report Inappropriate Content
Hi Tamil
Thank you very much , can you share how you do it ? Why it does not display the label ? i am using ver 9

- Mark as New
- Bookmark
- Subscribe
- Mute
- Subscribe to RSS Feed
- Permalink
- Report Inappropriate Content
Hi Yeo,
Yeo Poh sai wrote:
can you share how you do it ?
Here are the steps.
1) Change the straight table to pivot table.
2) Remove source field from dimension.
3) Drag and drop the YTD Sales from top to bottom.
4) Remove Wrap header text tick mark from presentation tab.
Yeo Poh sai wrote:
Why it does not display the label ? i am using ver 9
It should work. Could you please check the below attachment and confirm whether you still face the same issue.
- Mark as New
- Bookmark
- Subscribe
- Mute
- Subscribe to RSS Feed
- Permalink
- Report Inappropriate Content
Table:
LOAD * Inline [
SOURCE,LYSales,YTDSales
TDSS,910000,1040000
];
Take a pivot table chart and add two expression as LYsales-> Sum(LYSales) and YTDSales->Sum(YTDSales),
Don't need to add any dimension
then drag colums to row level

Put a space in Window Title in chart properties
- Mark as New
- Bookmark
- Subscribe
- Mute
- Subscribe to RSS Feed
- Permalink
- Report Inappropriate Content
Hi Tamil
Now working fine. ( I need to copy and paste then the label appear)
May i know it is possible to create this in QS ?
Paul
- Mark as New
- Bookmark
- Subscribe
- Mute
- Subscribe to RSS Feed
- Permalink
- Report Inappropriate Content
yes in Qliksense it is possible
- Mark as New
- Bookmark
- Subscribe
- Mute
- Subscribe to RSS Feed
- Permalink
- Report Inappropriate Content
Hi Pritam
Thank you very much for your sharing.
it is possible to make YTD Sales at row 1 ?
As my actual application have more then 2 column, it is possible ?
Paul
- Mark as New
- Bookmark
- Subscribe
- Mute
- Subscribe to RSS Feed
- Permalink
- Report Inappropriate Content
Hi Paul,
Yes, it is possible. I have recently started to work in Qlik Sense (I just checked before answer anything ![]() ) so sorry for taking long time to respond.
) so sorry for taking long time to respond.
- Mark as New
- Bookmark
- Subscribe
- Mute
- Subscribe to RSS Feed
- Permalink
- Report Inappropriate Content
Hi Pritam
Thank you very much for your sharing.
Paul Yeo
- « Previous Replies
-
- 1
- 2
- Next Replies »