Unlock a world of possibilities! Login now and discover the exclusive benefits awaiting you.
- Qlik Community
- :
- All Forums
- :
- QlikView App Dev
- :
- Re: How to display expression labels on x-axis
- Subscribe to RSS Feed
- Mark Topic as New
- Mark Topic as Read
- Float this Topic for Current User
- Bookmark
- Subscribe
- Mute
- Printer Friendly Page
- Mark as New
- Bookmark
- Subscribe
- Mute
- Subscribe to RSS Feed
- Permalink
- Report Inappropriate Content
How to display expression labels on x-axis
I am trying to display expression labels on x-axis and expression value on top of bar in a bar chart. I have a single dimension and 6 expressions, hence, i want each of the bars to be recognizable.
I have tried using Dual in expression, however, when i choose integer in my number tab, it displays the number only and when i select default, it displays the text only.
Please help.
Regards,
Salik
- Mark as New
- Bookmark
- Subscribe
- Mute
- Subscribe to RSS Feed
- Permalink
- Report Inappropriate Content
Can you provide sample app/screenshot of your requirement?
- Mark as New
- Bookmark
- Subscribe
- Mute
- Subscribe to RSS Feed
- Permalink
- Report Inappropriate Content
Try this,
Properties->Expression->Select expression and enable values on data points.
hope it will help......
- Mark as New
- Bookmark
- Subscribe
- Mute
- Subscribe to RSS Feed
- Permalink
- Report Inappropriate Content
Please refer the attached image, i am trying to display legends on the right top of the chart below the bars on x-axis.
- Mark as New
- Bookmark
- Subscribe
- Mute
- Subscribe to RSS Feed
- Permalink
- Report Inappropriate Content
Hi,
for values on bar go to properties->Expression->Select expression and enable values on data points and for legend on x-axis Go to your charts general tab and click on buttons Reset user sizing and Resize User Docking and apply ->ok then select chart press Ctrl+Shift you will see red square border for chart and legend drag legend part and drop to bottom of the chart
Hope this will work to your requirement
Regards,
Vijeta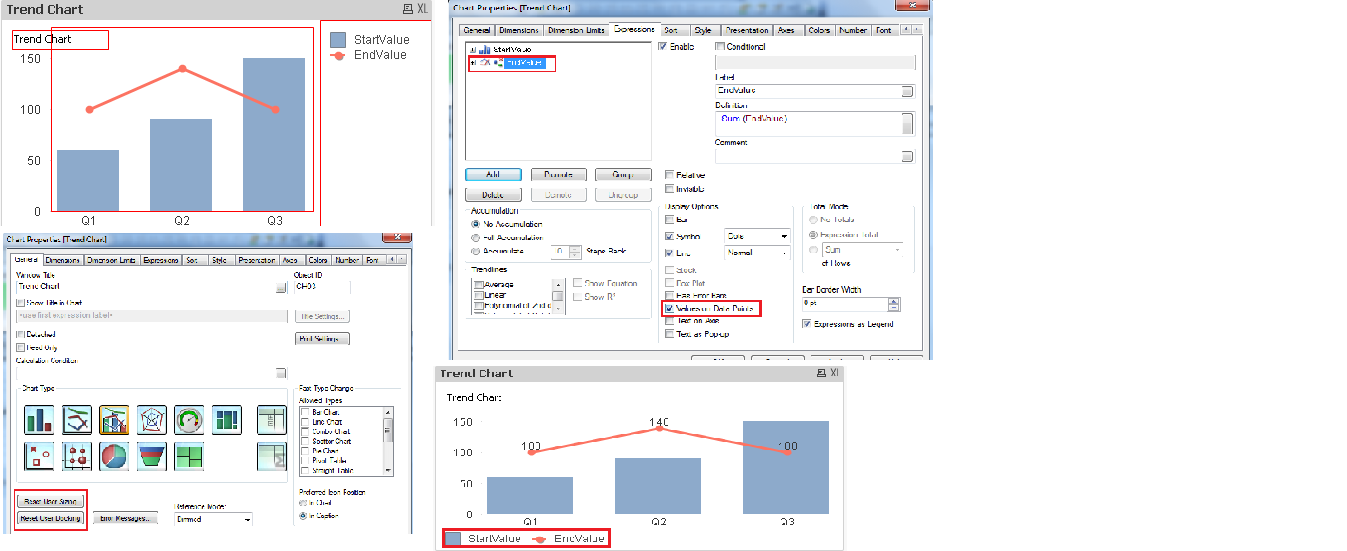
- Mark as New
- Bookmark
- Subscribe
- Mute
- Subscribe to RSS Feed
- Permalink
- Report Inappropriate Content
it does but not exactly how i wanted it to work. I wanted the labels to display in grey right below the x-axis. and not shifting legends to x-axis
- Mark as New
- Bookmark
- Subscribe
- Mute
- Subscribe to RSS Feed
- Permalink
- Report Inappropriate Content
I don't think QlikView will accommodate what you are looking for if you have a horizontal dimension (Month), even with only one possible value in that field.
If the Expressions in that image are all supposed to be "as of" April 2014, I would remove the Month Dimension entirely and add the "as of Month" information as the Chart Title. Then all you have to do is disable Show Legend on the Presentation tab of the chart's properties, and the Expression labels will appear on the axis.
- Mark as New
- Bookmark
- Subscribe
- Mute
- Subscribe to RSS Feed
- Permalink
- Report Inappropriate Content
Go to Presentation--> Uncheck 'Show Legend'
This will disable the dimension labels and show the expression labels on X axis instead.
- Mark as New
- Bookmark
- Subscribe
- Mute
- Subscribe to RSS Feed
- Permalink
- Report Inappropriate Content
Thanks Ankita, this solution worked for me.