Unlock a world of possibilities! Login now and discover the exclusive benefits awaiting you.
- Qlik Community
- :
- All Forums
- :
- QlikView App Dev
- :
- How to display tow values to use A Donut Chart
- Subscribe to RSS Feed
- Mark Topic as New
- Mark Topic as Read
- Float this Topic for Current User
- Bookmark
- Subscribe
- Mute
- Printer Friendly Page
- Mark as New
- Bookmark
- Subscribe
- Mute
- Subscribe to RSS Feed
- Permalink
- Report Inappropriate Content
How to display tow values to use A Donut Chart
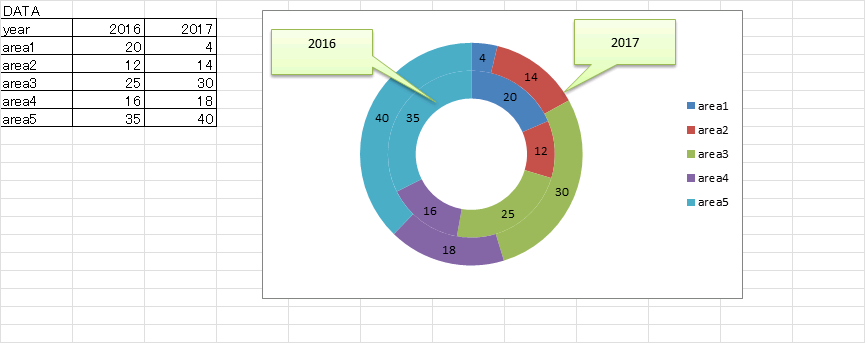
Hi, I would like to ask you for help.
I want to make a Donut Chart, such as the following
How can I make it?

Thank you so much for help!
- Tags:
- make a donut chart
Accepted Solutions
- Mark as New
- Bookmark
- Subscribe
- Mute
- Subscribe to RSS Feed
- Permalink
- Report Inappropriate Content
Hi,
As we know that pie chart can have only one measure, we can't achieve your requirement using a single chart. Hence a solution can be to use 2 pie charts and overlap them. I have attached an example.
Thanks
- Mark as New
- Bookmark
- Subscribe
- Mute
- Subscribe to RSS Feed
- Permalink
- Report Inappropriate Content
Hi
You can just use a pie chart using year as the dimension and then go to the style tab of the chart properties and choose your desired pie chart from the options listed.
Kindest regards
Brian
- Mark as New
- Bookmark
- Subscribe
- Mute
- Subscribe to RSS Feed
- Permalink
- Report Inappropriate Content
Hi
try this .
CrossTable(year, Sales)
LOAD * INLINE
[
AREA, 2016, 2017
area1, 20, 4
area2, 12, 14
area3, 25, 30
]
;
FYI ..I have attached do-nut chart as well
- Mark as New
- Bookmark
- Subscribe
- Mute
- Subscribe to RSS Feed
- Permalink
- Report Inappropriate Content
Thank you for your advice.
This chart needs tow measure.
Probably QV make one Circle for year and another Circle for area.
But I want to make one Circle for 2016 and another Circle for 2017.
It's difficult for me....
Thanks.
- Mark as New
- Bookmark
- Subscribe
- Mute
- Subscribe to RSS Feed
- Permalink
- Report Inappropriate Content
Thank you for your advice.
Ireally want to make what you suggest!
Unfortunately, My QV is personal edition. so I can't see your file.
I load CrossTable you show me.
and I set [year , sales] for measure.
But QV make one Circle for year and another Circle for area.
Please tell me where Imistake.
Thanks a lot.
- Mark as New
- Bookmark
- Subscribe
- Mute
- Subscribe to RSS Feed
- Permalink
- Report Inappropriate Content
Hi
I have inserted video in powerpoint 2013 , please open it and it will show how to allign the variables to DIMENSION and EXPRESSSION
- Mark as New
- Bookmark
- Subscribe
- Mute
- Subscribe to RSS Feed
- Permalink
- Report Inappropriate Content
I posted a reply for you at june 26.
But it's missing.
I tried your suggestion and I made what I want.
Thank you so much for your help.
- Mark as New
- Bookmark
- Subscribe
- Mute
- Subscribe to RSS Feed
- Permalink
- Report Inappropriate Content
Dear Alluraiah Allu.
You are so kindly.
I'll try your suggestion.
Thank you so much!
- Mark as New
- Bookmark
- Subscribe
- Mute
- Subscribe to RSS Feed
- Permalink
- Report Inappropriate Content
very nice