Unlock a world of possibilities! Login now and discover the exclusive benefits awaiting you.
- Qlik Community
- :
- All Forums
- :
- QlikView App Dev
- :
- Re: How to draw a pyramid shape made of several sh...
- Subscribe to RSS Feed
- Mark Topic as New
- Mark Topic as Read
- Float this Topic for Current User
- Bookmark
- Subscribe
- Mute
- Printer Friendly Page
- Mark as New
- Bookmark
- Subscribe
- Mute
- Subscribe to RSS Feed
- Permalink
- Report Inappropriate Content
How to draw a pyramid shape made of several shapes/text objects with each one of the objects containing a KPI?
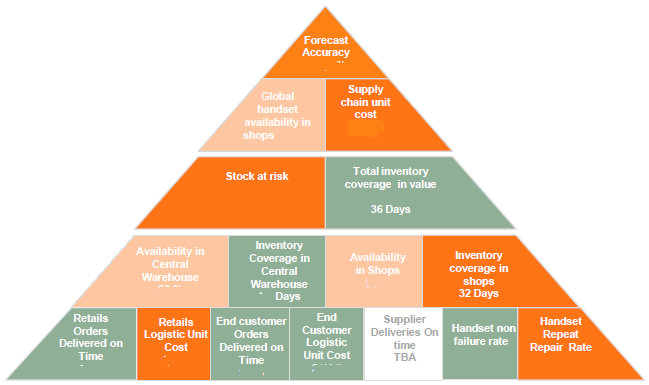
I have been given the task of drawing a pyramid shape made up of several shapes/ text objects with each one of the objects containing a KPI.
The pyramid shall consist of a number of KPIs (each in a particular side of the pyramid). As per the requirement, the KPIs shall change color based on their values (I.e. yellow in case the value is below 50% and green in case it is above).
Can you guys advise how to proceed with creating the pyramid?
- Mark as New
- Bookmark
- Subscribe
- Mute
- Subscribe to RSS Feed
- Permalink
- Report Inappropriate Content
I think this couldn't be native built within qv. The only possibility would be to create a picture from each pyramid-part and in each color which you needed and then use them as background-picture for the textboxes and put them all together beside and over eachother whereby the colors from each piece would be controlled by visibilty-conditions - but I think it will be need a long and quite frustrating time until you get a "nice" result (probably counted in days and not in hours ...).
Maybe there are extensions available which could be adjust in this kind and if not I would suggest to look for another possibility to display these content - maybe a block-chart - then the content is (or should be) more important then the layout.
- Marcus
- Mark as New
- Bookmark
- Subscribe
- Mute
- Subscribe to RSS Feed
- Permalink
- Report Inappropriate Content
I would recommend create the images (other than Squares or rectangles type) outside of Qlikview (in PPT) and store with different required colors. Yellow, Green, Red colors based on the requirement. Write the custom expression based on KPI value pick the correct image on the Text object expression.