Unlock a world of possibilities! Login now and discover the exclusive benefits awaiting you.
- Qlik Community
- :
- All Forums
- :
- QlikView App Dev
- :
- Re: How to get Breakdowns of Total
- Subscribe to RSS Feed
- Mark Topic as New
- Mark Topic as Read
- Float this Topic for Current User
- Bookmark
- Subscribe
- Mute
- Printer Friendly Page
- Mark as New
- Bookmark
- Subscribe
- Mute
- Subscribe to RSS Feed
- Permalink
- Report Inappropriate Content
How to get Breakdowns of Total
Hi,
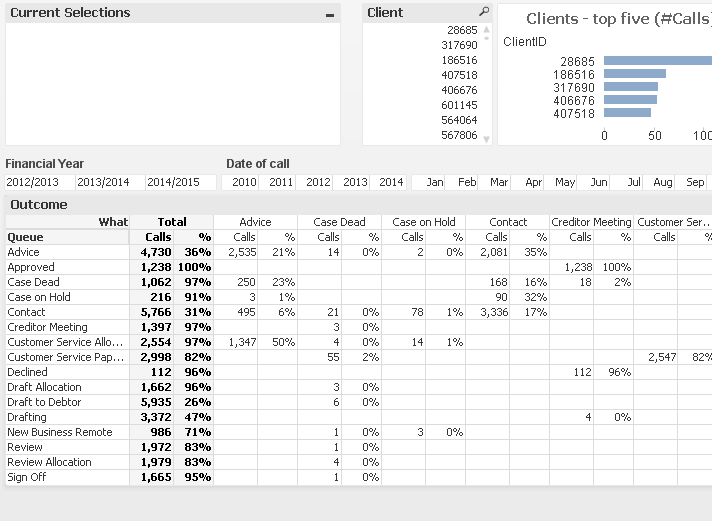
I have straight table in attached qvw. I need to show the break down of each Queue. I have Total Queue already created but I would need the Breakdowns which was showing in attached png.
could anyone help me by looking into attached please.
Thanks.
- Tags:
- new_to_qlikview
- Mark as New
- Bookmark
- Subscribe
- Mute
- Subscribe to RSS Feed
- Permalink
- Report Inappropriate Content

- Mark as New
- Bookmark
- Subscribe
- Mute
- Subscribe to RSS Feed
- Permalink
- Report Inappropriate Content
when I am trying to drag nothing chamges for me please help please
- Mark as New
- Bookmark
- Subscribe
- Mute
- Subscribe to RSS Feed
- Permalink
- Report Inappropriate Content
Thanks and when I am doing this it is showing blue line at vertical place not horizontal.do I need to change anything?
- Mark as New
- Bookmark
- Subscribe
- Mute
- Subscribe to RSS Feed
- Permalink
- Report Inappropriate Content
Thanks and I can able to see Horizontal column but it is taking too long to appear. Could you let me know please how can I get individual percentages(%) which is showing in your screen shot.
- Mark as New
- Bookmark
- Subscribe
- Mute
- Subscribe to RSS Feed
- Permalink
- Report Inappropriate Content
Cant help till later, driving home
- Mark as New
- Bookmark
- Subscribe
- Mute
- Subscribe to RSS Feed
- Permalink
- Report Inappropriate Content
Amelia,
How about the attached solution? I have Queue on the Y-axis and What on the x-axis. Changed to count HistoryID instead of ClientID as a client can make several calls. You could easily change back to ClientID again though. You also have the %-calculation.

Hope this helps.
Best regards,
Christian
- Mark as New
- Bookmark
- Subscribe
- Mute
- Subscribe to RSS Feed
- Permalink
- Report Inappropriate Content
Hi Christian,
Thanks very much. I am getting values different when HistoryID is used as the vales are showing very ;arge compared when I use ClientID.Could I know how to calculate the exact values which are coming from access databaes? please help me. As it is showing different figures and exactly I would need to show how the Total breakdown into individual Queues along horizotal and vertical.
- Mark as New
- Bookmark
- Subscribe
- Mute
- Subscribe to RSS Feed
- Permalink
- Report Inappropriate Content
In the presentation tab you click the 'Partial Sum' checkbox on whichever expression you want to total. You can also have it at the top/bottom or left/right by changing the Subtotals from top to bottom also on the presentation tab
- Mark as New
- Bookmark
- Subscribe
- Mute
- Subscribe to RSS Feed
- Permalink
- Report Inappropriate Content
By selecting "Show Partial Sums" on "Chart Properties [Outcome] / Presentation"
But Attention in the Field "Dimensions and Expressions" "What" has to be selected first!
- Mark as New
- Bookmark
- Subscribe
- Mute
- Subscribe to RSS Feed
- Permalink
- Report Inappropriate Content
Thanks. Actually I am getting values very large figures. how can I set this?