Unlock a world of possibilities! Login now and discover the exclusive benefits awaiting you.
- Qlik Community
- :
- All Forums
- :
- QlikView App Dev
- :
- How to get Distinct Values in Chart
- Subscribe to RSS Feed
- Mark Topic as New
- Mark Topic as Read
- Float this Topic for Current User
- Bookmark
- Subscribe
- Mute
- Printer Friendly Page
- Mark as New
- Bookmark
- Subscribe
- Mute
- Subscribe to RSS Feed
- Permalink
- Report Inappropriate Content
How to get Distinct Values in Chart
Hi,
Can Some one help me with my Question below
I have Multiple Rows in table Box like below
ProjectID [Total Service Credit Balance in Hours] as Field Names
Project 1-- 280 Hours
project 1 -280 hours
Project 1--280 Hours
Project 2--156 Hours
Project 2 --156 Hours
Project 2--156 Hours
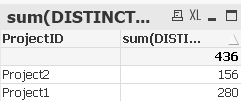
I want to value of both projects as 436 so i tried to write like below
=(AGGR(SUM(DISTINCT [Total Service Credit Balance in Hours]),[Project ID])) in Chart Properties expressions.
But it works when i select for single project ID in filters , and if i remove filter i am not getting any values in my Chart expressions.
Can some one help me here , Please Thanks.
Best Regards,
HK
- Mark as New
- Bookmark
- Subscribe
- Mute
- Subscribe to RSS Feed
- Permalink
- Report Inappropriate Content
May be Aggr inside sum. Like this?
SUM(AGGR([Total Service Credit Balance in Hours],[Project ID]))
- Mark as New
- Bookmark
- Subscribe
- Mute
- Subscribe to RSS Feed
- Permalink
- Report Inappropriate Content
I think that you have an issue with the data-quality and you should solve them first before trying to bypass them with complex expressions. In your case seems a data-cleaning within the script like this:
upper(trim(replace([Project ID], '--', '-'))) as [Project ID]
or maybe a mapping-solution for this suitable: Mapping … and not the geographical kind.
- Marcus
- Mark as New
- Bookmark
- Subscribe
- Mute
- Subscribe to RSS Feed
- Permalink
- Report Inappropriate Content
Works Fine for me?
As Marcus says, may be you have data quality issues in your Data Model? Pl share a sample so that we can better understand your problem?