Unlock a world of possibilities! Login now and discover the exclusive benefits awaiting you.
- Qlik Community
- :
- All Forums
- :
- QlikView App Dev
- :
- How to increase the intensity of colour in SVG Rea...
- Subscribe to RSS Feed
- Mark Topic as New
- Mark Topic as Read
- Float this Topic for Current User
- Bookmark
- Subscribe
- Mute
- Printer Friendly Page
- Mark as New
- Bookmark
- Subscribe
- Mute
- Subscribe to RSS Feed
- Permalink
- Report Inappropriate Content
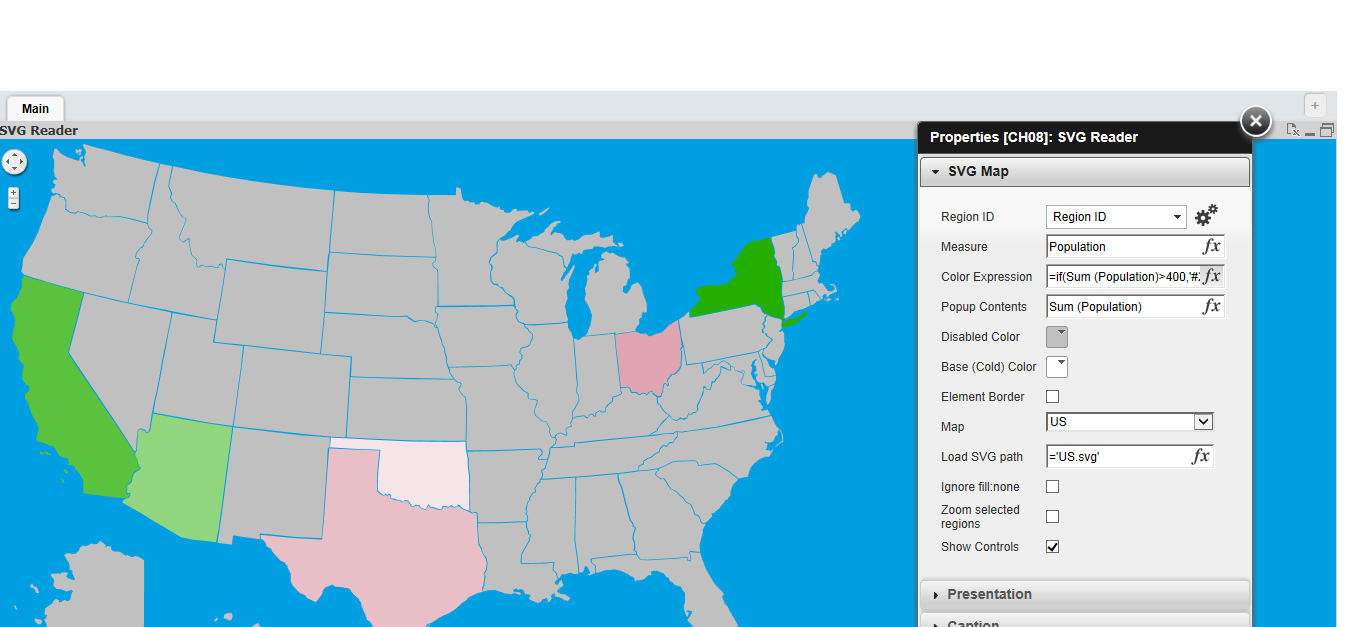
How to increase the intensity of colour in SVG Reader for low values?
Hi,
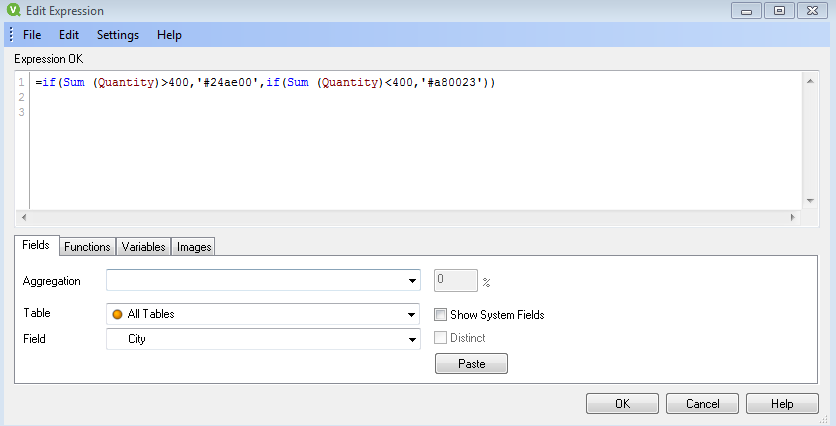
I have created a US map, with few states in data. I want to show colour for these charts ranging from dark red (low population) to dark green(high population). I'm successful at getting dark green colour for high population but with low populations I only get faded red colour.
There exist one more issue too, that is I'm not able to set the state's name visible.
Can some one please give me a solution!
Im also attaching my data.
Note: I'm using trail version so I cant open your solution in the form of ".qvw" file. Please explain your solution in text. Thanking you in advance.
- « Previous Replies
-
- 1
- 2
- Next Replies »
- Mark as New
- Bookmark
- Subscribe
- Mute
- Subscribe to RSS Feed
- Permalink
- Report Inappropriate Content
That is only possible as a popup / hover over I believe
- Mark as New
- Bookmark
- Subscribe
- Mute
- Subscribe to RSS Feed
- Permalink
- Report Inappropriate Content
Or you could alter the SVG (use something like inkscape) and add them in as text seeing as they are fixed anyway?
- Mark as New
- Bookmark
- Subscribe
- Mute
- Subscribe to RSS Feed
- Permalink
- Report Inappropriate Content
I finished it.. if you have time please go through this Re: How to make the state names visible in svg reader?
Thank you very much for your help.
- Mark as New
- Bookmark
- Subscribe
- Mute
- Subscribe to RSS Feed
- Permalink
- Report Inappropriate Content
Yes so that's just a new SVG file with the names on it.
Great that you are all sorted 
- « Previous Replies
-
- 1
- 2
- Next Replies »