Unlock a world of possibilities! Login now and discover the exclusive benefits awaiting you.
- Qlik Community
- :
- All Forums
- :
- QlikView App Dev
- :
- Re: How to integrate RGB expression in sum express...
- Subscribe to RSS Feed
- Mark Topic as New
- Mark Topic as Read
- Float this Topic for Current User
- Bookmark
- Subscribe
- Mute
- Printer Friendly Page
- Mark as New
- Bookmark
- Subscribe
- Mute
- Subscribe to RSS Feed
- Permalink
- Report Inappropriate Content
How to integrate RGB expression in sum expression?
Hi,
I want to integrate the RGB expression in:
=Sum({$<timeline={'T-4','T-5','T-6','T-7'}>}values)
to have a black "RGB (0,0,0)" line in a line chart which is now automatically set to blue. How or where do I need to integrate the RGB expression?
Thanks
-Koper Nikus
- Tags:
- new_to_qlikview
Accepted Solutions
- Mark as New
- Bookmark
- Subscribe
- Mute
- Subscribe to RSS Feed
- Permalink
- Report Inappropriate Content
Go to Expressions and under the color option
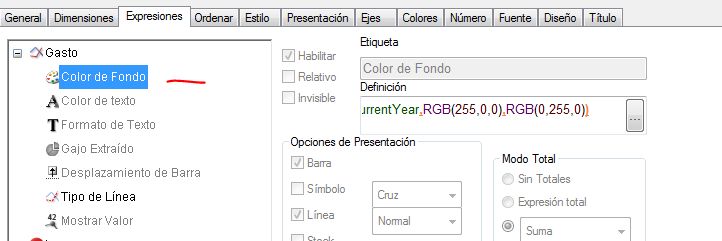
Write the expression you need, in this example
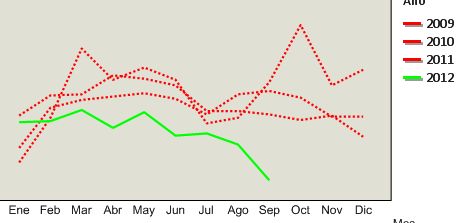
IF(CalendarYear<>vCurrentYear,RGB(255,0,0),RGB(0,255,0))
See the result
Hope this help
- Mark as New
- Bookmark
- Subscribe
- Mute
- Subscribe to RSS Feed
- Permalink
- Report Inappropriate Content
u can set this in calculated color under color tab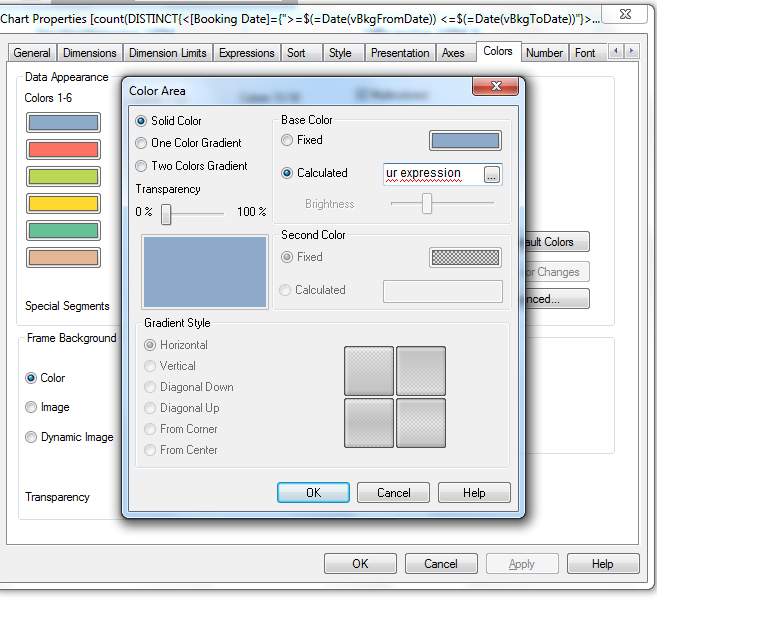
- Mark as New
- Bookmark
- Subscribe
- Mute
- Subscribe to RSS Feed
- Permalink
- Report Inappropriate Content
Well nearly perfect, but I want to give every single line in my line chart a special colour and two lines shall have the same colour. In the calculated colour I can not chosse a single line in my chart.
- Mark as New
- Bookmark
- Subscribe
- Mute
- Subscribe to RSS Feed
- Permalink
- Report Inappropriate Content
Go to Expressions and under the color option
Write the expression you need, in this example
IF(CalendarYear<>vCurrentYear,RGB(255,0,0),RGB(0,255,0))
See the result
Hope this help