Unlock a world of possibilities! Login now and discover the exclusive benefits awaiting you.
- Qlik Community
- :
- All Forums
- :
- QlikView App Dev
- :
- ¿How to plot a trend line? / ¿Cómo graficar una li...
- Subscribe to RSS Feed
- Mark Topic as New
- Mark Topic as Read
- Float this Topic for Current User
- Bookmark
- Subscribe
- Mute
- Printer Friendly Page
- Mark as New
- Bookmark
- Subscribe
- Mute
- Subscribe to RSS Feed
- Permalink
- Report Inappropriate Content
¿How to plot a trend line? / ¿Cómo graficar una linea de tendencia?
Good Morning,
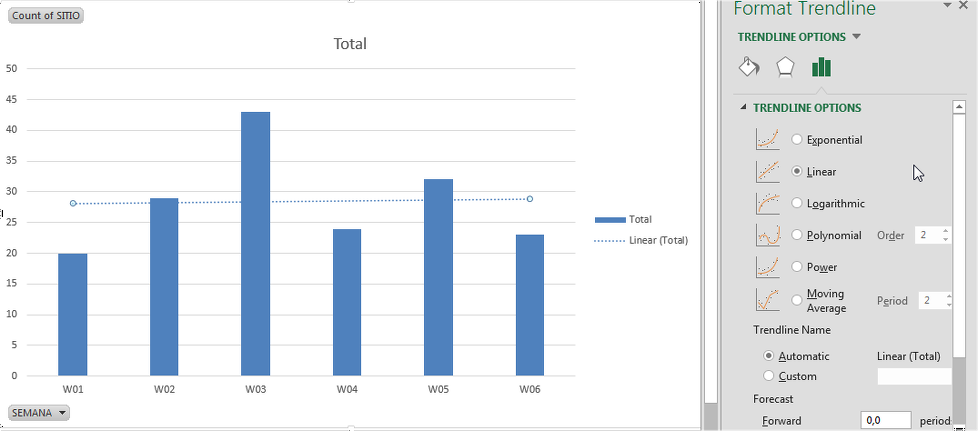
I'm trying to plot a trend line on a chart combined and I could not. I need to know if it is with some mathematical function or a QLIKSENSE option.
I need to add the trend line values Visits ( Blue Line ).
The following is the graph in which I need to add the trendline.
(Attachments)
Thanks You!
- Mark as New
- Bookmark
- Subscribe
- Mute
- Subscribe to RSS Feed
- Permalink
- Report Inappropriate Content
Hello Juan,
You could attach an example of the application? If I understand the requirement, it is not as easy as an option. You should add an extra term, but to give you the exact formula, I need to know the names of the fields and how they are structured.
Greetings,
Andrés
- - - -
Hola Juan,
Podrías adjuntar un ejemplo de la aplicación? Si entiendo bien el requerimiento, no es tan fácil como una opción. Tendrías que añadir una expresión extra, pero para darte la fórmula exacta, necesito saber los nombres de los campos y cómo están estructurados.
Un saludo,
Andrés
Note: Edited by Community Moderator to include English translation as a courtesy. Please use English in main forums.
- Mark as New
- Bookmark
- Subscribe
- Mute
- Subscribe to RSS Feed
- Permalink
- Report Inappropriate Content
Good afternoon Andrés,
Thank you very much for answering, what I need it is to draw a trendline of activities which I have registered DataFill (Excel), I'm driving the fields are:
[SITE] [DATE]
Where the Site column number of sites visited are entered and as of the week of the visit.

Stay tuned, thanks.
- - - -
Buenas tardes Andres,
Muchas gracias por contestar, lo que necesito es sacar una linea de tendencia de unas actividades que tengo registradas en el DATAFILL (Excel), los campos que estoy manejando son:
[SITIO] [FECHA]
Donde en la columna SITIO se ingresan la cantidad de sitios visitados y en FECHA la semana de la visita.

Quedo atento, gracias.
Note: Edited by Community Moderator to include English translation as a courtesy. Please use English in main forums.