Unlock a world of possibilities! Login now and discover the exclusive benefits awaiting you.
- Qlik Community
- :
- All Forums
- :
- QlikView App Dev
- :
- How to set up dynamic monthly counts in "text in c...
- Subscribe to RSS Feed
- Mark Topic as New
- Mark Topic as Read
- Float this Topic for Current User
- Bookmark
- Subscribe
- Mute
- Printer Friendly Page
- Mark as New
- Bookmark
- Subscribe
- Mute
- Subscribe to RSS Feed
- Permalink
- Report Inappropriate Content
How to set up dynamic monthly counts in "text in chart" field
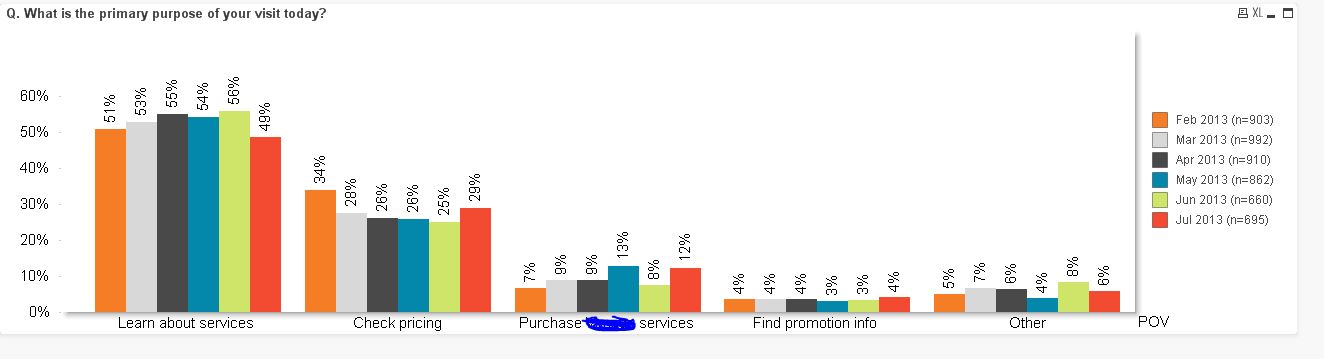
Our client requested the following text on the top of a chart:
Feb 2013 (n=100) Mar 2013 (n=200) Apr (n=300) ... up to the last month
I would really like to set that up dynamically like it is possible in a list box by MYear with calculated expression
=' (n='&Count(MYear)&')'
MYear is calculated on the load like
LOAD MonthName(Monthstart(date(DATEFILED))) as MYear
Any help is greatly appreciated
Thank you very much!
- « Previous Replies
-
- 1
- 2
- Next Replies »
Accepted Solutions
- Mark as New
- Bookmark
- Subscribe
- Mute
- Subscribe to RSS Feed
- Permalink
- Report Inappropriate Content
The last post doesn't work, but there is another solution:
to use calculated dimension as
=MYear&' (n='&aggr(Count(MYear),MYear)&')'
- Mark as New
- Bookmark
- Subscribe
- Mute
- Subscribe to RSS Feed
- Permalink
- Report Inappropriate Content
Try this
=subfield(getcurrentselection(),':',-1)&' '&' (n='&Count(MYear)&')'
- Mark as New
- Bookmark
- Subscribe
- Mute
- Subscribe to RSS Feed
- Permalink
- Report Inappropriate Content
in script-
LOAD MonthName(Monthstart(date(DATEFILED))) as MYear
month(date(Datefield)) as month
then use this
= 'n= ' & count(if(Datefield>=MonthStart(max(Datefield) and Datefield<=MonthEnd(max(Datefield)),MYear))
- Mark as New
- Bookmark
- Subscribe
- Mute
- Subscribe to RSS Feed
- Permalink
- Report Inappropriate Content
I got
(n=5022)
which is the total number for 6 months
- Mark as New
- Bookmark
- Subscribe
- Mute
- Subscribe to RSS Feed
- Permalink
- Report Inappropriate Content
I think the 'text in chart' expression is not evaluated over the dimension. It would be easier if you just added an expression in the expressions tab (=' (n='&Count(MYear)&')') and deselect the line/bar and select the text on axis option. (I'm assuming MYear is your dimension)
- Mark as New
- Bookmark
- Subscribe
- Mute
- Subscribe to RSS Feed
- Permalink
- Report Inappropriate Content
That expression does not return any results. I really believe that aggr function has to be involved.
Thank you anyway!
- Mark as New
- Bookmark
- Subscribe
- Mute
- Subscribe to RSS Feed
- Permalink
- Report Inappropriate Content
This is a really good approach, but I have another dimension beside MYear and counts really get messed.
Could be good for other charts
Thanks a lot
- Mark as New
- Bookmark
- Subscribe
- Mute
- Subscribe to RSS Feed
- Permalink
- Report Inappropriate Content
Ah, you have a second dimension....To prevent the messiness (multiple texts are plotted over each other) use this:
if(rowno()=1,YourExpression,'')
- Mark as New
- Bookmark
- Subscribe
- Mute
- Subscribe to RSS Feed
- Permalink
- Report Inappropriate Content
This is the best approach I got with the following expression:
= if(RowNo(TOTAL)=1,MYear&' (n='&aggr(Count(MYear),MYear)&')','')
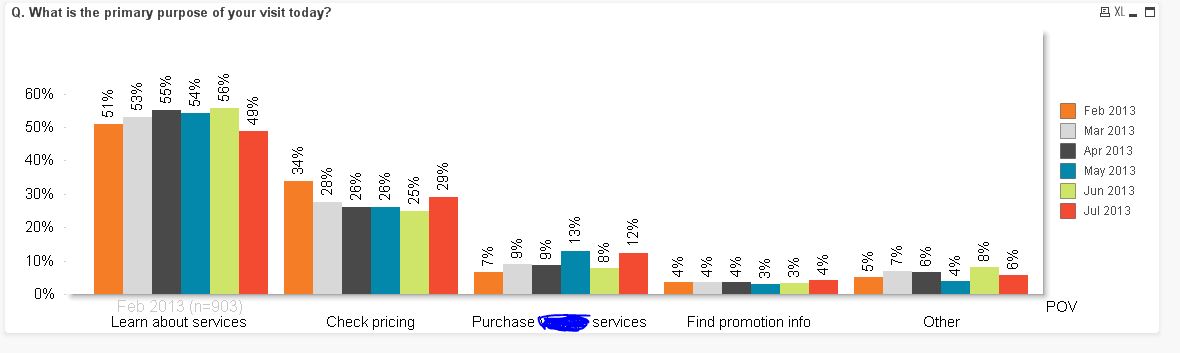
I get the right number for the first month, but cannot see other months.
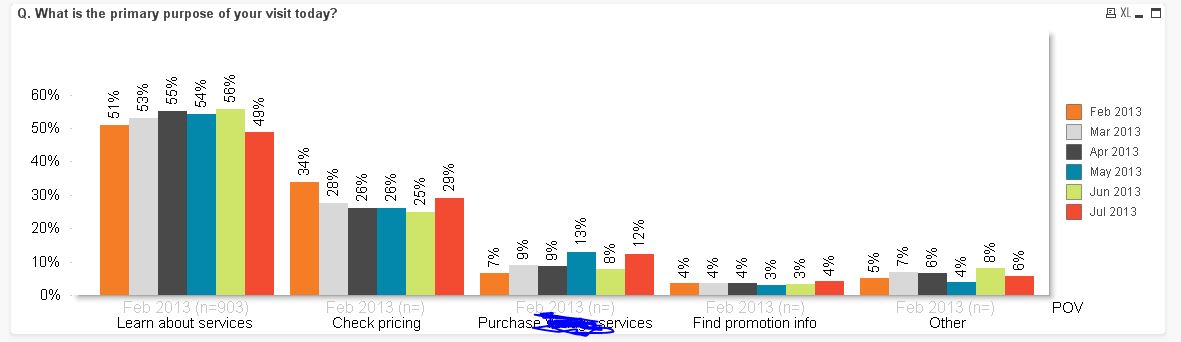
When I do not use TOTAL,
= if(RowNo()=1,MYear&' (n='&aggr(Count(MYear),MYear)&')','')
I get :
- Mark as New
- Bookmark
- Subscribe
- Mute
- Subscribe to RSS Feed
- Permalink
- Report Inappropriate Content
I'm afraid I haven't been looking very good at your dimensions. Normally I use this technique where the periods are the first dimension, the Rowno()=1 is there to display only for each first value of the first dimension (make an excel export to see what I mean). The expression is also without aggregates as I do not need them (the dimensions are doing the aggregations) and the base values are displayed to the corresponding dimension values.
In your case that would mean displaying the base for each value in the period 5 times, for which there is no room. Unless offcourse you change the display of the labels to vertical (in propertiestab axes). Not very nice but you also can't display the months bases for each value of the other dimension as there are only five and you have six months
- « Previous Replies
-
- 1
- 2
- Next Replies »