Unlock a world of possibilities! Login now and discover the exclusive benefits awaiting you.
- Qlik Community
- :
- All Forums
- :
- QlikView App Dev
- :
- Re: How to show count of values in pie chart with ...
- Subscribe to RSS Feed
- Mark Topic as New
- Mark Topic as Read
- Float this Topic for Current User
- Bookmark
- Subscribe
- Mute
- Printer Friendly Page
- Mark as New
- Bookmark
- Subscribe
- Mute
- Subscribe to RSS Feed
- Permalink
- Report Inappropriate Content
How to show count of values in pie chart with legend?
Hi,
I have below data in excel file.
| ID | XXApple | XXFruit | XXSavouri | XXCrisps | XXMelon |
| 56356 | 0 | 2 | 0 | 0 | 2 |
| 464745 | 0 | 2 | 0 | 0 | 2 |
| 65365 | 0 | 0 | 0 | 0 | 2 |
| 56467645 | 0 | 2 | 0 | 0 | 0 |
| 7756763464 | 0 | 2 | 0 | 0 | 2 |
| 7466346 | 0 | 2 | 0 | 0 | 2 |
| 67647657 | 0 | 0 | 0 | 0 | 2 |
| 5746456 | 2 | 0 | 0 | 0 | 0 |
| 574634534 | 0 | 0 | 0 | 2 | 2 |
| 74356456 | 2 | 0 | 0 | 0 | 0 |
| 54476445 | 0 | 0 | 0 | 0 | 0 |
| 45656546 | 2 | 0 | 0 | 0 | 0 |
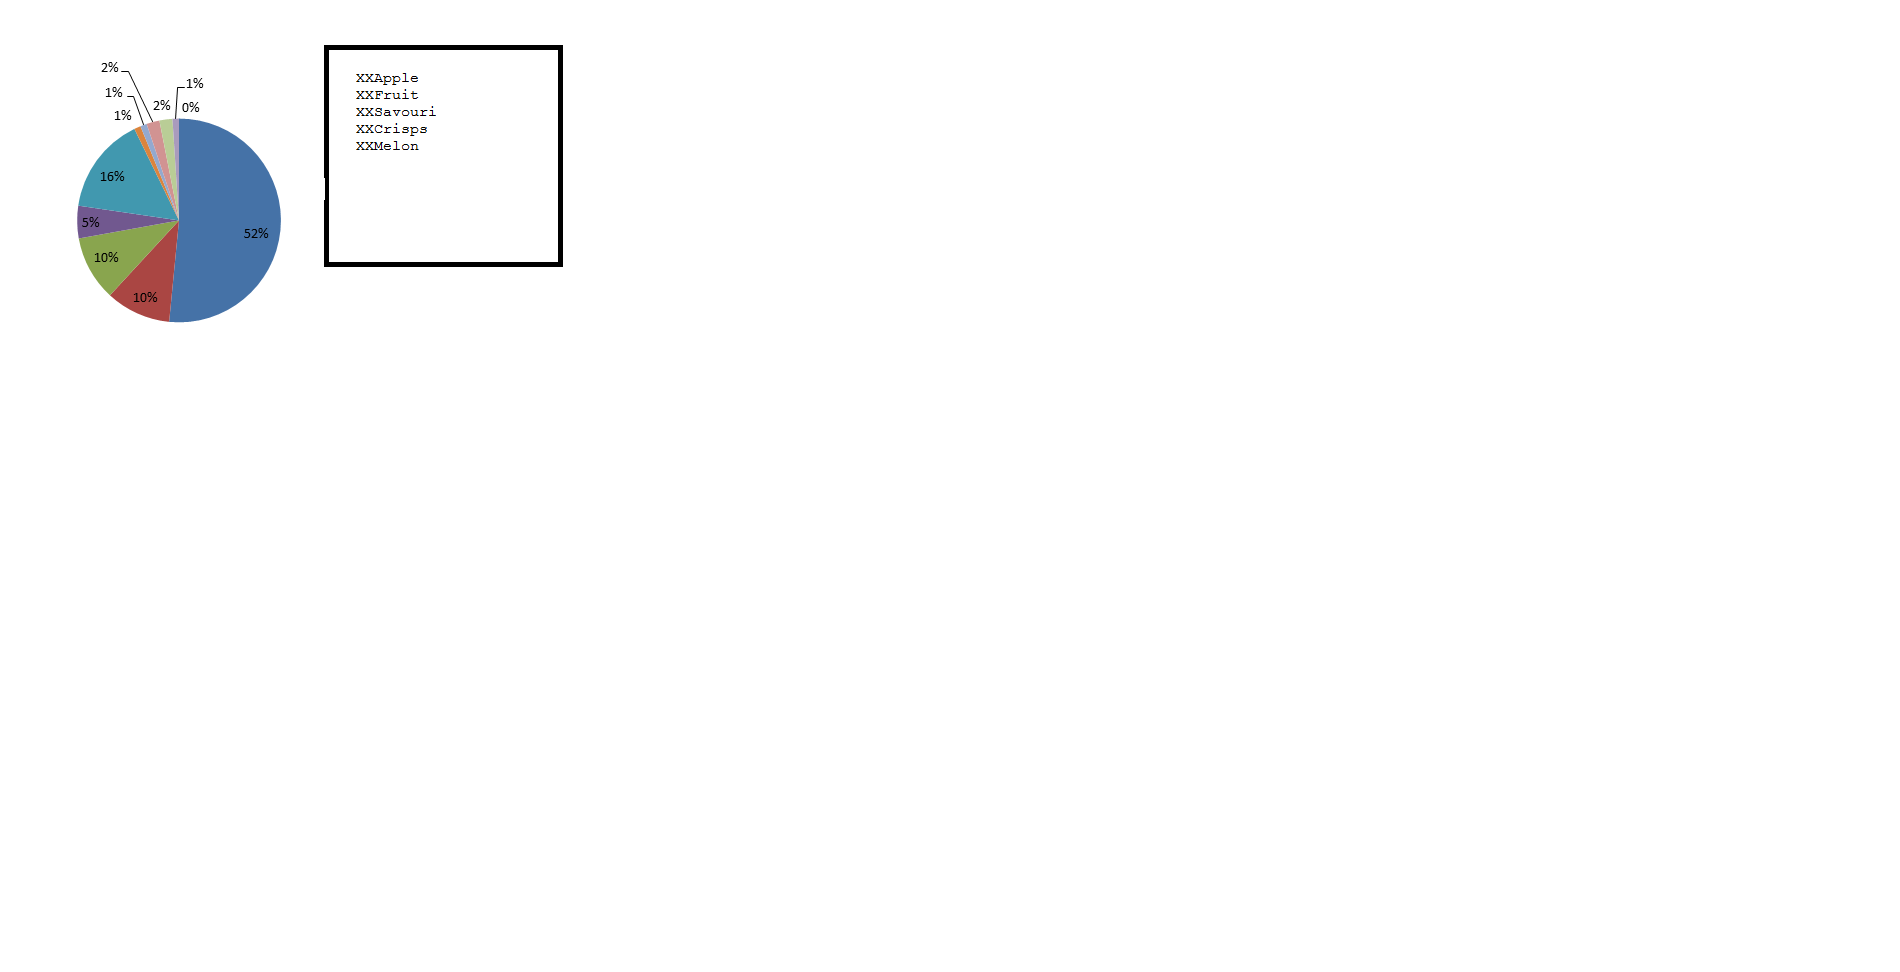
I need to show the count of ID percentages where column values are 2 in pie chart with legend at the side as
XXApple
XXFruit
XXSavouri
XXCrisps
XXMelon.
Please can anyone suggest me.
Thanks.
- Tags:
- new_to_qlikview
Accepted Solutions
- Mark as New
- Bookmark
- Subscribe
- Mute
- Subscribe to RSS Feed
- Permalink
- Report Inappropriate Content
The crosstable is still valid in access there just isn't a wizard for it :
Below will generate a qlikview table with 3 fields:
First field is 'Salesman ID' -> values are IDs straight from field with same name in access DB
2nd field is 'Fields' -> values are 'Salesman' and 'Distributor ID'... the remaining field names in the query
3rd field is 'Values' -> contains the row values from the Salesman and distributor id fields in the DB.
ODBC CONNECT TO [Salesman;DBQ=C:\Qlik Resources\Demos\10 Minute Demo\Data\Salesman.mdb];
CrossTable(Fields,Values)
LOAD `Salesman ID`,
Salesman,
`Distributor ID`;
SQL SELECT `Salesman ID`,
Salesman,
`Distributor ID`
FROM SALESMAN;
- Mark as New
- Bookmark
- Subscribe
- Mute
- Subscribe to RSS Feed
- Permalink
- Report Inappropriate Content
output should be as shown in attached. Please suggest
- Mark as New
- Bookmark
- Subscribe
- Mute
- Subscribe to RSS Feed
- Permalink
- Report Inappropriate Content
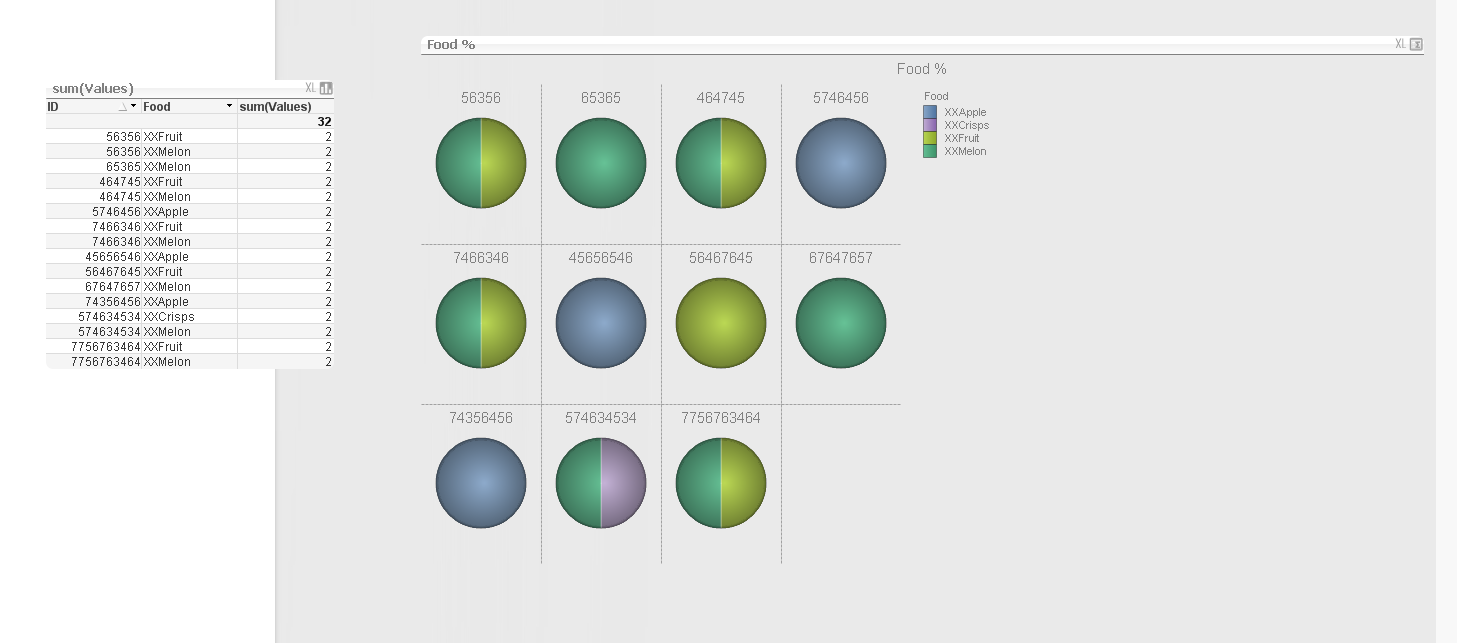
Here is a sample but i'm not sure if its what you asked for. Please comment on what you might need differnt
- Mark as New
- Bookmark
- Subscribe
- Mute
- Subscribe to RSS Feed
- Permalink
- Report Inappropriate Content
Thanks. This matches if the data is in excel. what if the source data is coming from ms access table. how to use cross table on access table data. sorry the one which I mentioned is sample data. please suggest
EDIT : the format is same which I have in access table.
- Mark as New
- Bookmark
- Subscribe
- Mute
- Subscribe to RSS Feed
- Permalink
- Report Inappropriate Content
Hi Amelia,
first load your excel table which is crosstable into straight table then use set analysis.
Table:
CrossTable(type, Data)
LOAD ID,
XXApple,
XXFruit,
XXSavouri,
XXCrisps,
XXMelon
FROM
[..\Solve.xlsx]
(ooxml, embedded labels, table is Sheet1);
then use the expression:
=
count(distinct {<Data={'2'}>}ID)
dimesion: type ...............in your pie chart,nad check mark relatve in expression tab while creating your pie chart.
Regards
Saurabh
- Mark as New
- Bookmark
- Subscribe
- Mute
- Subscribe to RSS Feed
- Permalink
- Report Inappropriate Content
The crosstable is still valid in access there just isn't a wizard for it :
Below will generate a qlikview table with 3 fields:
First field is 'Salesman ID' -> values are IDs straight from field with same name in access DB
2nd field is 'Fields' -> values are 'Salesman' and 'Distributor ID'... the remaining field names in the query
3rd field is 'Values' -> contains the row values from the Salesman and distributor id fields in the DB.
ODBC CONNECT TO [Salesman;DBQ=C:\Qlik Resources\Demos\10 Minute Demo\Data\Salesman.mdb];
CrossTable(Fields,Values)
LOAD `Salesman ID`,
Salesman,
`Distributor ID`;
SQL SELECT `Salesman ID`,
Salesman,
`Distributor ID`
FROM SALESMAN;
- Mark as New
- Bookmark
- Subscribe
- Mute
- Subscribe to RSS Feed
- Permalink
- Report Inappropriate Content
Thanks. I did give a try the same and it worked. Thanks for giving me the solution.