Unlock a world of possibilities! Login now and discover the exclusive benefits awaiting you.
- Qlik Community
- :
- All Forums
- :
- QlikView App Dev
- :
- Re: How to show legend/data label directly in char...
- Subscribe to RSS Feed
- Mark Topic as New
- Mark Topic as Read
- Float this Topic for Current User
- Bookmark
- Subscribe
- Mute
- Printer Friendly Page
- Mark as New
- Bookmark
- Subscribe
- Mute
- Subscribe to RSS Feed
- Permalink
- Report Inappropriate Content
How to show legend/data label directly in chart area?
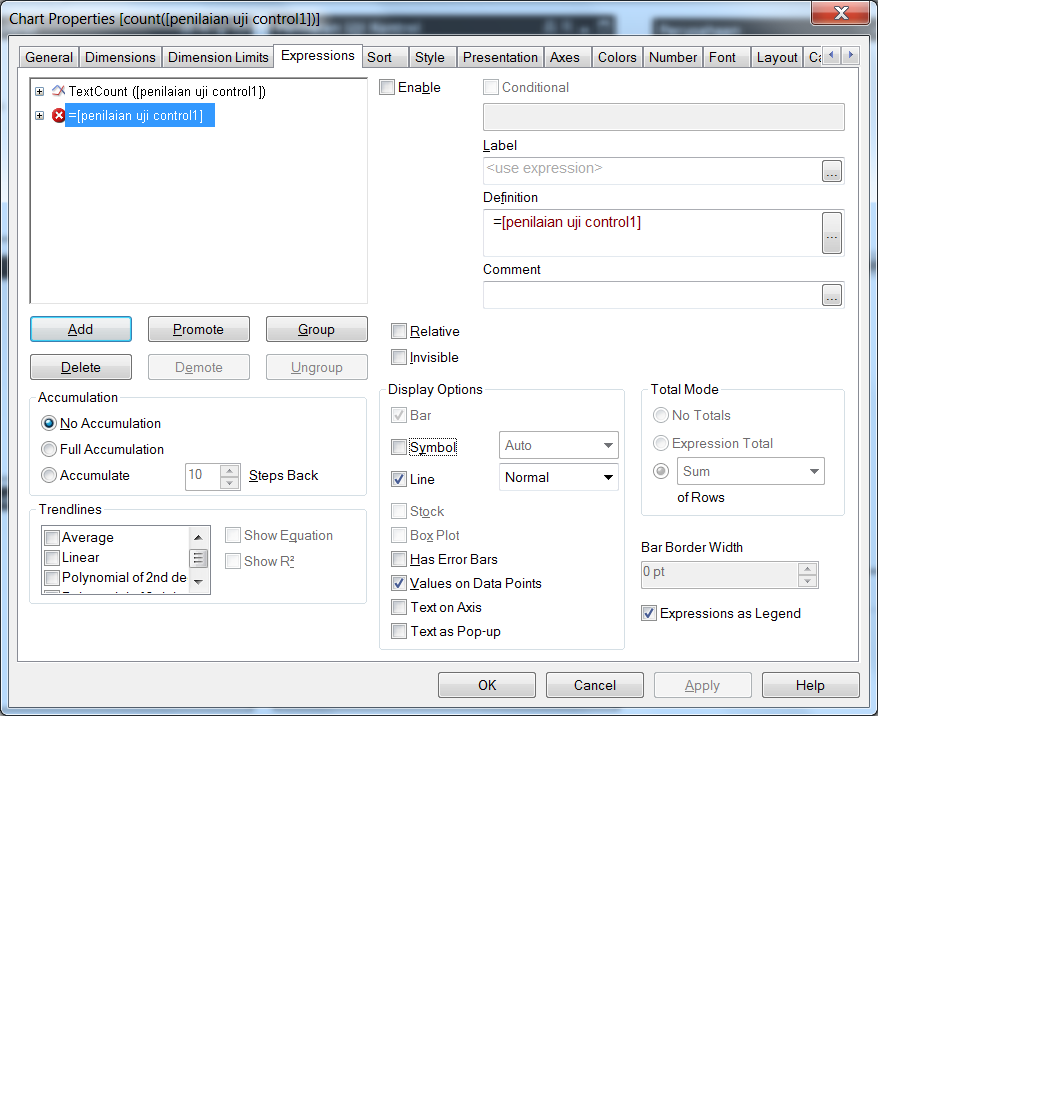
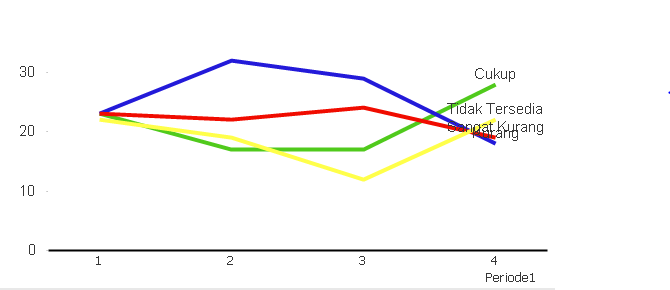
Hi, I want to show Data Label in the chart like this:
tried the trick with second expression as value data point but didn't work correctly. If that second expression is enabled, the chart won't show correctly in categories.
Accepted Solutions
- Mark as New
- Bookmark
- Subscribe
- Mute
- Subscribe to RSS Feed
- Permalink
- Report Inappropriate Content
Hi
In my example:
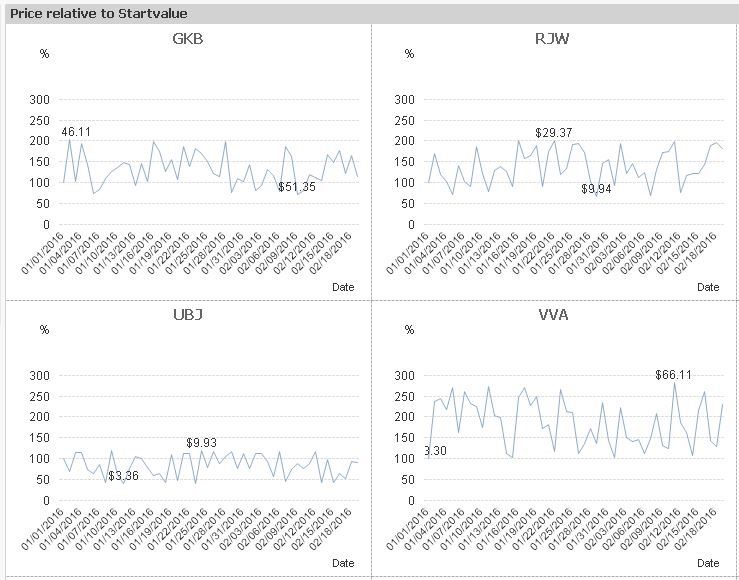
Dual(If(Date=Max(total Date), Country, ''),Sum(Sales))
The Dual function will only return a text value when the date matches the maximum date. Otherwise, it is blank. So, when we enable the Values on Data Points option, it only displays a value for the last data point.
Syntax:
Dual(text, number)
The dual() function allows us to specify the individual text and number parts to be combined into a single dual value:
- Mark as New
- Bookmark
- Subscribe
- Mute
- Subscribe to RSS Feed
- Permalink
- Report Inappropriate Content
You can either add the Text to the chart using the Presentation Tab or use DUAL if you have very dynamic information.
- Mark as New
- Bookmark
- Subscribe
- Mute
- Subscribe to RSS Feed
- Permalink
- Report Inappropriate Content
- Hi
- try this
- Add a new line chart. Add two dimensions, Date and Country.
- Add the following expression:
Dual(
If(Date=Max(total Date), Country, ''),
Sum(Sales)
}
- On the Expressions tab, ensure that the Values on Data Points option is checked.
- Click on Next until you get to the Presentation tab. Deselect the Show Legend option
- Mark as New
- Bookmark
- Subscribe
- Mute
- Subscribe to RSS Feed
- Permalink
- Report Inappropriate Content
Dual seems promising. Looked around in the forum but I need help to explain the logic of the Dual statement.
Can you provide example?
I've checked this: Dual Function in a line graph
- Mark as New
- Bookmark
- Subscribe
- Mute
- Subscribe to RSS Feed
- Permalink
- Report Inappropriate Content
Hi
In my example:
Dual(If(Date=Max(total Date), Country, ''),Sum(Sales))
The Dual function will only return a text value when the date matches the maximum date. Otherwise, it is blank. So, when we enable the Values on Data Points option, it only displays a value for the last data point.
Syntax:
Dual(text, number)
The dual() function allows us to specify the individual text and number parts to be combined into a single dual value:
- Mark as New
- Bookmark
- Subscribe
- Mute
- Subscribe to RSS Feed
- Permalink
- Report Inappropriate Content
- Mark as New
- Bookmark
- Subscribe
- Mute
- Subscribe to RSS Feed
- Permalink
- Report Inappropriate Content
Your explanation really helps. Thanks!
Unfortunately it only works on something that has maximum value, the original content of period is something like Q1, Q2, etc so I had to work around slightly to get what I want. May be I can enhance the script a bit later, it's not very urgent now.
Lastly the overlying text, I recall reading somewhere in the community that we can't do anything about it, can we?
- Mark as New
- Bookmark
- Subscribe
- Mute
- Subscribe to RSS Feed
- Permalink
- Report Inappropriate Content
Hi,
If you expand(drag) your graph , this overlaying of text will be minimized .
It seems you need 'country name' on maximum sales ??
would you please post your examplet data or qvw file .
so that , I can help you ..
Regards
Allu