Unlock a world of possibilities! Login now and discover the exclusive benefits awaiting you.
- Qlik Community
- :
- All Forums
- :
- QlikView App Dev
- :
- Re: How to sum of quantity product based
- Subscribe to RSS Feed
- Mark Topic as New
- Mark Topic as Read
- Float this Topic for Current User
- Bookmark
- Subscribe
- Mute
- Printer Friendly Page
- Mark as New
- Bookmark
- Subscribe
- Mute
- Subscribe to RSS Feed
- Permalink
- Report Inappropriate Content
How to sum of quantity product based
i have 2 excels sheet
1) product
2) product quantity
product:
| productcode | name |
| 101 | panadol |
| 102 | dispren |
| 103 | levlox |
| 105 | augmenten |
| 106 | ethrocin |
product quantity:
| productcode | qty |
| 101 | 34 |
| 101 | 55 |
| 101 | 66 |
| 101 | 23 |
| 102 | 55 |
| 102 | 66 |
| 102 | 33 |
| 103 | 23 |
| 103 | 66 |
| 103 | 77 |
| 105 | 88 |
| 106 | 99 |
| 106 | 100 |
how to make sum of qty like ( after distinct, sum should come.. i guess ....)
product 101 sum should be 178
product 102 sum should be 154
product 106 sum should be 199 and so
i need to show it on chart
kindly help me
- Tags:
- qlikview_scripting
- Mark as New
- Bookmark
- Subscribe
- Mute
- Subscribe to RSS Feed
- Permalink
- Report Inappropriate Content
use expression
= Aggr(Sum (qty),productcode)
HTH
Rohit
- Mark as New
- Bookmark
- Subscribe
- Mute
- Subscribe to RSS Feed
- Permalink
- Report Inappropriate Content
Load them into qv as-it-is(two seperate tables) with proper table names. The two tables would be linked with productcode field. Now in the front-end chart:
Dimension: productcode
Exp: Sum(qty)
- Mark as New
- Bookmark
- Subscribe
- Mute
- Subscribe to RSS Feed
- Permalink
- Report Inappropriate Content
Hi Mohammad,
see the attached example:
- Mark as New
- Bookmark
- Subscribe
- Mute
- Subscribe to RSS Feed
- Permalink
- Report Inappropriate Content
its not making sum
- Mark as New
- Bookmark
- Subscribe
- Mute
- Subscribe to RSS Feed
- Permalink
- Report Inappropriate Content
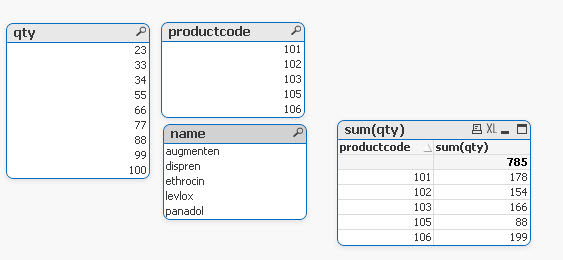
Hi,
Is this what you wanted to achieve?
I have attached a qvw in which I have created a chart of the products' "name" as a Dimension (you can put the "productcode" instead) and "Sum( DISTINCT (qty))" as an Expression.
Hope you find it useful 
- Mark as New
- Bookmark
- Subscribe
- Mute
- Subscribe to RSS Feed
- Permalink
- Report Inappropriate Content
Directory;
LOAD productcode,
name
FROM
[163788.xlsx]
(ooxml, embedded labels, table is Product);
Directory;
LOAD productcode,
qty
FROM
[163788.xlsx]
(ooxml, embedded labels, table is [product quantity]);