Unlock a world of possibilities! Login now and discover the exclusive benefits awaiting you.
- Qlik Community
- :
- All Forums
- :
- QlikView App Dev
- :
- Re: How to sum with letters included?
- Subscribe to RSS Feed
- Mark Topic as New
- Mark Topic as Read
- Float this Topic for Current User
- Bookmark
- Subscribe
- Mute
- Printer Friendly Page
- Mark as New
- Bookmark
- Subscribe
- Mute
- Subscribe to RSS Feed
- Permalink
- Report Inappropriate Content
How to sum with letters included?
Hallo everyone,
I am quite new to QlikView and I wonder if someone could help me with the following issue:
I would like to sum a colum which is easy. But now I have the problem that letters are in that same column. If I insert a sum formula the letters vanish to "0" what they shouldn't do. I need them there but not to be count.
Can anyone help, please?
Thank you very much in advance!
- « Previous Replies
-
- 1
- 2
- Next Replies »
- Mark as New
- Bookmark
- Subscribe
- Mute
- Subscribe to RSS Feed
- Permalink
- Report Inappropriate Content
I am sorry, but it still is not the solution.
I think the main problem here is, that the text "abc" is not counted as number but as text so that all following numbers are not getting counted - not even horizontically.
- Mark as New
- Bookmark
- Subscribe
- Mute
- Subscribe to RSS Feed
- Permalink
- Report Inappropriate Content
Have not done any testing, but I don't think it should give any performance differences....
- Mark as New
- Bookmark
- Subscribe
- Mute
- Subscribe to RSS Feed
- Permalink
- Report Inappropriate Content
Can you share your application and explain what you want in it?
- Mark as New
- Bookmark
- Subscribe
- Mute
- Subscribe to RSS Feed
- Permalink
- Report Inappropriate Content
What you mean by below?
"I think the main problem here is, that the text "abc" is not counted as number but as text"
- Mark as New
- Bookmark
- Subscribe
- Mute
- Subscribe to RSS Feed
- Permalink
- Report Inappropriate Content
Hey everyone.
I try to sum and average the data below. My Problem is, when reading in the data, the "abc" is shown as "text" (Standing left). For the average the whole column does not get counted so that I get a wrong average. I want it to be written as text but the column should Count. I think that I am expressing myself too complicated. Sorry about that. I might find a Workaround solution.
| Jan | Feb | Mrz | Apr | Mai | Jun | Jul | Aug | Sep | Okt | Nov | Dez | Ø |
| 2,00 | 3,00 | 8,00 | 1,00 | 0,00 | 9,00 | 2,00 | 3,00 | 8,00 | 1,00 | 0,00 | 9,00 | 3,83 |
| 2,00 | 3,00 | 8,00 | 1,00 | 0,00 | 9,00 | 2,00 | 3,00 | 8,00 | 1,00 | 0,00 | 9,00 | 3,83 |
| 2,00 | 3,00 | 8,00 | 1,00 | 0,00 | 9,00 | 2,00 | 3,00 | 8,00 | 1,00 | 0,00 | 9,00 | 3,83 |
| abc | 3,00 | 8,00 | 1,00 | 0,00 | 9,00 | 2,00 | 3,00 | 8,00 | 1,00 | 0,00 | 9,00 | 0,00 |
| 2,00 | 3,00 | 8,00 | 1,00 | 0,00 | 9,00 | 2,00 | 3,00 | 8,00 | 1,00 | 0,00 | 9,00 | 3,83 |
| 2,00 | 3,00 | 8,00 | 1,00 | 0,00 | 9,00 | 2,00 | 3,00 | 8,00 | abc | 0,00 | 9,00 | 0,00 |
| 2,00 | 3,00 | 8,00 | 1,00 | 0,00 | 9,00 | 2,00 | 3,00 | 8,00 | 1,00 | 0,00 | 9,00 | 3,83 |
| 2,00 | 3,00 | 8,00 | 1,00 | 0,00 | 9,00 | 2,00 | 3,00 | 8,00 | 1,00 | 0,00 | 9,00 | 3,83 |
| 2,00 | 3,00 | 8,00 | 1,00 | 0,00 | 9,00 | 2,00 | 3,00 | 8,00 | 1,00 | 0,00 | 9,00 | 3,83 |
- Mark as New
- Bookmark
- Subscribe
- Mute
- Subscribe to RSS Feed
- Permalink
- Report Inappropriate Content
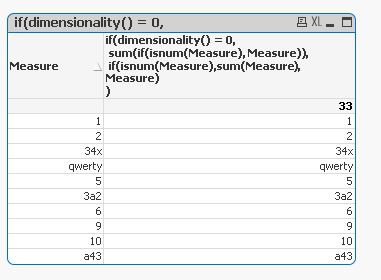
Try this expression
if(dimensionality() = 0,
sum(if(isnum(Measure), Measure)),
if(isnum(Measure),sum(Measure), Measure)
)
- Mark as New
- Bookmark
- Subscribe
- Mute
- Subscribe to RSS Feed
- Permalink
- Report Inappropriate Content
All you need to use here is to use Dimensionality() and SecondaryDimensionality() functions... Basically these functions will let you use different expressions for total vs. main expression.... Now, since the only thing you have been sharing is raw data, I don't know how your chart is structured, so it would be very difficult to give the exact expression. But see if you can work with this
The second dimension... or how to use secondarydimensionality()
Or else share a sample of your app
Preparing examples for Upload - Reduction and Data Scrambling
- Mark as New
- Bookmark
- Subscribe
- Mute
- Subscribe to RSS Feed
- Permalink
- Report Inappropriate Content
Thank you very much for so much support!
I fixed my problem in using the rangesum function.
- « Previous Replies
-
- 1
- 2
- Next Replies »