Unlock a world of possibilities! Login now and discover the exclusive benefits awaiting you.
- Qlik Community
- :
- All Forums
- :
- QlikView App Dev
- :
- I have a question about the use of advanced formul...
- Subscribe to RSS Feed
- Mark Topic as New
- Mark Topic as Read
- Float this Topic for Current User
- Bookmark
- Subscribe
- Mute
- Printer Friendly Page
- Mark as New
- Bookmark
- Subscribe
- Mute
- Subscribe to RSS Feed
- Permalink
- Report Inappropriate Content
I have a question about the use of advanced formula (aggr), please help!
Now I have an urgent question. Please help me.
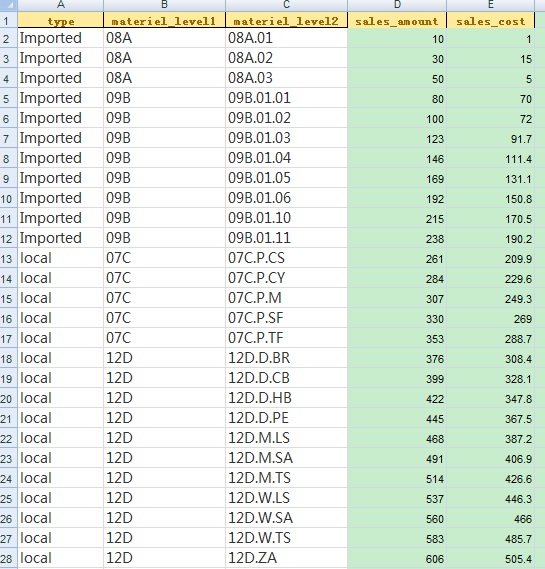
There is a data source, picture 1
Type, material 1, material 2, amount, cost
Use Qlikview production of the effect of the picture 2, the first dimension, the total amount, cost, gross profit is also very simple, but according to the material 2 gross margin >=60%, and the total 60%> gross margin =>50% count and total amount and accounting
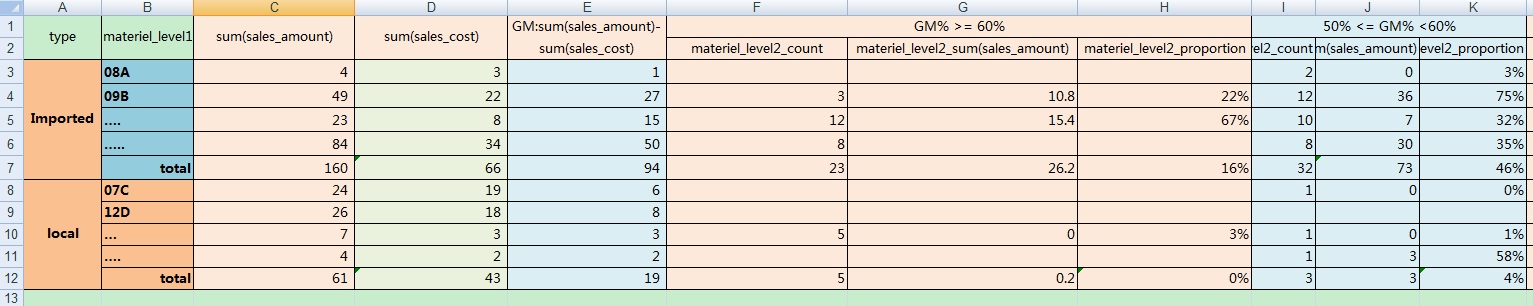
How to write a script to calculate the formula?
I think I need to use aggr, but it's always wrong.
Please help me!
- « Previous Replies
-
- 1
- 2
- Next Replies »
Accepted Solutions
- Mark as New
- Bookmark
- Subscribe
- Mute
- Subscribe to RSS Feed
- Permalink
- Report Inappropriate Content
- Mark as New
- Bookmark
- Subscribe
- Mute
- Subscribe to RSS Feed
- Permalink
- Report Inappropriate Content
Hi,
The aggr function can be tricky to use, please check out this post and let me know if it helps:
From what you have provided you will also need to incorporate some set Analysis into your formula. The post that I refer to often is:
Set Analysis: syntaxes, examples
Kind Regards
Arohan
- Mark as New
- Bookmark
- Subscribe
- Mute
- Subscribe to RSS Feed
- Permalink
- Report Inappropriate Content
Hello!
One possible way is
SCRIPT:
Load sum(GrossMargin) as TotalGrossMargin
Resident TableNameWhereGrossMarginFieldIsPresent;
DASHBOARD:
For the straight table chart, for the expression of material_level2_count;
=if(aggr(sum(GrossMargin),type,material_level1)>=0.6*TotalGrossMargin,aggr(Count(GrossMargin),type,material_level1),'-')
Likewise, for the other expressions...
Regards 
- Mark as New
- Bookmark
- Subscribe
- Mute
- Subscribe to RSS Feed
- Permalink
- Report Inappropriate Content
I am very sorry, in fact, the material dimension of the data source is more complex than the picture1, there are materials_level1, material_level2, and material_level3 , materials_level4..........., because of the data physical model, you provide the way is not very convenient, still thank you for your reply.I might end up thinking that way.
Thanks.
- Mark as New
- Bookmark
- Subscribe
- Mute
- Subscribe to RSS Feed
- Permalink
- Report Inappropriate Content
can you please attach the application with sample data.
Regards,
Padmanabhan
- Mark as New
- Bookmark
- Subscribe
- Mute
- Subscribe to RSS Feed
- Permalink
- Report Inappropriate Content
Thank you very much for your help, this way very good, but there is a problem, when 'TYPE' are the same material_level2, the statistics of aggr have problems, for example: 'Imported'have '08A.03' 'local' also have "08A.03" material_level2, statistics will wrong, I try to add a column , "aggr ((sum (sales amount) -sum (cost of sales)) /sum (sales amount). MATERIEL_LEVEL2, TYPE)" join type dimension parameters, data are correct, But your formula adds the TYPE dimension, still not right!!should how to modify it???
Do you know what I mean?
- Mark as New
- Bookmark
- Subscribe
- Mute
- Subscribe to RSS Feed
- Permalink
- Report Inappropriate Content
I have tried this way, not a complete success.
When the material data is 0, there will be a problem.
Look at the red mark on the Excel file. "08A.03" local
I think, this question about the missing value.
Regards
Rocco
- Mark as New
- Bookmark
- Subscribe
- Mute
- Subscribe to RSS Feed
- Permalink
- Report Inappropriate Content
The problem is really complicated, and I find that this is a problem when TYPE-Imported and Local are in the same MATERIEL_LEVEL2-"08A.03". I think it should be the TYPE dimension is not completely separate, so I have a way of thinking, the report is divided into two parts, a "Imported", a "Local", but I still have problems, now look forward to your reply.
Regards
- Mark as New
- Bookmark
- Subscribe
- Mute
- Subscribe to RSS Feed
- Permalink
- Report Inappropriate Content
Hi friend, please see the attachment and I reply with GILLES.
Regards
- Mark as New
- Bookmark
- Subscribe
- Mute
- Subscribe to RSS Feed
- Permalink
- Report Inappropriate Content
Rocco,
What I did was wrong we can not use aggr function inside the {set expression} of our expression. The Set expression is evaluated once per chart and not by lline. Instead we can use if expression as you can see in the qvw attached.
Regards
Gilles
- « Previous Replies
-
- 1
- 2
- Next Replies »