Unlock a world of possibilities! Login now and discover the exclusive benefits awaiting you.
- Qlik Community
- :
- All Forums
- :
- QlikView App Dev
- :
- Re: I need value mapped with a particular date
- Subscribe to RSS Feed
- Mark Topic as New
- Mark Topic as Read
- Float this Topic for Current User
- Bookmark
- Subscribe
- Mute
- Printer Friendly Page
- Mark as New
- Bookmark
- Subscribe
- Mute
- Subscribe to RSS Feed
- Permalink
- Report Inappropriate Content
I need value mapped with a particular date
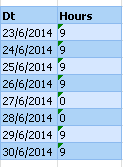
Hi Guyz i have a table:

What i need is.
I have a Date Separately called (23/06/2014)
like

These dates will keep on changing every day or week.So i need their hours to be displayed accordingly
And these Dates you can take as text values generated by some expression.
I used Substringcount
If(SubStringCount(Date#(Dt,'DD/MM/YYYY'),WeekStart(Today()))>0,Hours)
Also tried WildMatch but didnt succeed.
- « Previous Replies
-
- 1
- 2
- Next Replies »
- Mark as New
- Bookmark
- Subscribe
- Mute
- Subscribe to RSS Feed
- Permalink
- Report Inappropriate Content
take pivot table
in dimension-> date
and expression hours or sum(hours)
and drag date to horizontal
hope this helps
- Mark as New
- Bookmark
- Subscribe
- Mute
- Subscribe to RSS Feed
- Permalink
- Report Inappropriate Content
Thanks for the reply
1)Yeah i tried making pivot table
But it didnt show up.I mean table was not formed.
2) I need data for a current week that is from Monday to Thursday to be displayed only
- Mark as New
- Bookmark
- Subscribe
- Mute
- Subscribe to RSS Feed
- Permalink
- Report Inappropriate Content
Provide sample data file.. You can achieve this by Mapping Load or Lookup function
- Mark as New
- Bookmark
- Subscribe
- Mute
- Subscribe to RSS Feed
- Permalink
- Report Inappropriate Content
Hi,
Can u attach a sample source file ?
And, also clarify if you want the table to be horizontally alligned with the Total of the hours.
Regards.
- Mark as New
- Bookmark
- Subscribe
- Mute
- Subscribe to RSS Feed
- Permalink
- Report Inappropriate Content
Yeah Manish i need that only but on UI side.
- Mark as New
- Bookmark
- Subscribe
- Mute
- Subscribe to RSS Feed
- Permalink
- Report Inappropriate Content
Hi Priyanka,
1)Table you can see is the data.
2)And the dates you can see in the text box are the text.
So i need to get hours if that text value and the value in Dt matches.
Hope you understand this.
and yeah total is not the problem
- Mark as New
- Bookmark
- Subscribe
- Mute
- Subscribe to RSS Feed
- Permalink
- Report Inappropriate Content
Hi,
Please find the attached file.
Hope it helps !
Regards.
- Mark as New
- Bookmark
- Subscribe
- Mute
- Subscribe to RSS Feed
- Permalink
- Report Inappropriate Content
use tables as mapping table
Date:
mapping
Load
Date, Hour
from path
use date in different blue buttons
and use
applymap('Date',1) below first date
applymap('Date',2) below second date
applymap('Date',3) below third date
applymap('Date',4) below fourth date
-----
---- till
applymap('Date',8) below eirth date
hope this helps
- Mark as New
- Bookmark
- Subscribe
- Mute
- Subscribe to RSS Feed
- Permalink
- Report Inappropriate Content
Hope this will help you....
Thanks,
Yogesh Bari
- « Previous Replies
-
- 1
- 2
- Next Replies »