Unlock a world of possibilities! Login now and discover the exclusive benefits awaiting you.
- Qlik Community
- :
- All Forums
- :
- QlikView App Dev
- :
- In ComboChart newly created months added and on a...
- Subscribe to RSS Feed
- Mark Topic as New
- Mark Topic as Read
- Float this Topic for Current User
- Bookmark
- Subscribe
- Mute
- Printer Friendly Page
- Mark as New
- Bookmark
- Subscribe
- Mute
- Subscribe to RSS Feed
- Permalink
- Report Inappropriate Content
In ComboChart newly created months added and on axis should show data points
Hi have only may2011,may/213 on dimention tab combo chart ,So I create auto generate to monthyear for that year all months
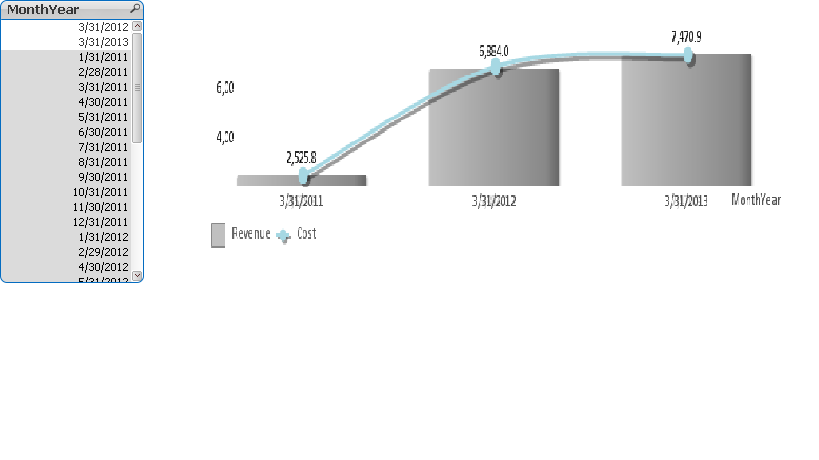
I taken dimension as Monthyear there showing only Relavent data as it is in my data soure .I auto generated month from min year to max year now i want to add the that added monthes into my x_aixes(i.e dimesions ) .I'm wondering if any one helps me.
Regards
Sunil
- Mark as New
- Bookmark
- Subscribe
- Mute
- Subscribe to RSS Feed
- Permalink
- Report Inappropriate Content
if you're asking to show missing year-month on the x axis, go to presentation tab and uncheck "suppress zero-values" or dimension tab and check "show all values"
- Mark as New
- Bookmark
- Subscribe
- Mute
- Subscribe to RSS Feed
- Permalink
- Report Inappropriate Content
Try adding + sum({1} 0) to your expressions and disabling the option Suppress Zero-Values.
talk is cheap, supply exceeds demand
- Mark as New
- Bookmark
- Subscribe
- Mute
- Subscribe to RSS Feed
- Permalink
- Report Inappropriate Content
For autal month data in my qvd it's work not for auto genarated months . what you mean add expression can you elaborate it gwassenaar.