Unlock a world of possibilities! Login now and discover the exclusive benefits awaiting you.
- Qlik Community
- :
- All Forums
- :
- QlikView App Dev
- :
- Include $ sign on vertical axis
- Subscribe to RSS Feed
- Mark Topic as New
- Mark Topic as Read
- Float this Topic for Current User
- Bookmark
- Subscribe
- Mute
- Printer Friendly Page
- Mark as New
- Bookmark
- Subscribe
- Mute
- Subscribe to RSS Feed
- Permalink
- Report Inappropriate Content
Include $ sign on vertical axis
Hi,
I've looked at some of the settings for this bar chart I have and didn't find what I was looking for.
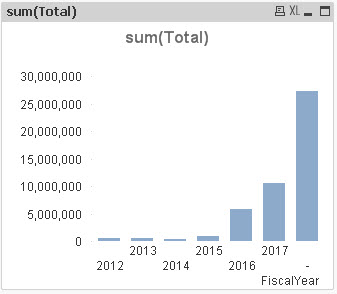
How do I include the dollar sign ($) on the vertical axis? Example, I want to show $5,000,000, $10,000,000
Thank you
- « Previous Replies
- Next Replies »
- Mark as New
- Bookmark
- Subscribe
- Mute
- Subscribe to RSS Feed
- Permalink
- Report Inappropriate Content
Please see the attached qvw file.
- Mark as New
- Bookmark
- Subscribe
- Mute
- Subscribe to RSS Feed
- Permalink
- Report Inappropriate Content
Sorry I didn't notice you had attached a qvw file before I uploaded mine. If I follow your sample, the only fiscal year that will work is 2012. The other years do not work.
- Mark as New
- Bookmark
- Subscribe
- Mute
- Subscribe to RSS Feed
- Permalink
- Report Inappropriate Content
Its probably not the perfect, but check it out
- Mark as New
- Bookmark
- Subscribe
- Mute
- Subscribe to RSS Feed
- Permalink
- Report Inappropriate Content
I guess the static step in your case would be like this:
Max(Aggr(Sum(Total), FiscalYear))
- Mark as New
- Bookmark
- Subscribe
- Mute
- Subscribe to RSS Feed
- Permalink
- Report Inappropriate Content
The above step will not work. It only shows one data point on the Y-axis. The one you attached in "Sample3.qvw" actually works much better for this set of data. But anyway thanks so much for your help. I got some ideas now.
- Mark as New
- Bookmark
- Subscribe
- Mute
- Subscribe to RSS Feed
- Permalink
- Report Inappropriate Content
Hahahahaha I forgot to type /5
Max(Aggr(Sum(Total), FiscalYear))/5
This is what I meant  . Apologize for all confusions
- Mark as New
- Bookmark
- Subscribe
- Mute
- Subscribe to RSS Feed
- Permalink
- Report Inappropriate Content
One last question for the day. How would you make "5" to be dynamic in the above step code? If I had 10 years, the above would fail to work properly, right?
- Mark as New
- Bookmark
- Subscribe
- Mute
- Subscribe to RSS Feed
- Permalink
- Report Inappropriate Content
5 is used for how many data points you want to see on the Y-Axis. This would not be impacted by changes on the number of values on x-axis. Does that make sense?
- Mark as New
- Bookmark
- Subscribe
- Mute
- Subscribe to RSS Feed
- Permalink
- Report Inappropriate Content
Ah... Got you. Thanks
- Mark as New
- Bookmark
- Subscribe
- Mute
- Subscribe to RSS Feed
- Permalink
- Report Inappropriate Content
No problem at all, if you are satisfied and have resolved you issue, I would suggest to close this thread by marking correct and helpful responses.
Qlik Community Tip: Marking Replies as Correct or Helpful
Best,
Sunny
- « Previous Replies
- Next Replies »