Unlock a world of possibilities! Login now and discover the exclusive benefits awaiting you.
- Qlik Community
- :
- All Forums
- :
- QlikView App Dev
- :
- Insert Legend in QlikView Chart and retain the sto...
- Subscribe to RSS Feed
- Mark Topic as New
- Mark Topic as Read
- Float this Topic for Current User
- Bookmark
- Subscribe
- Mute
- Printer Friendly Page
- Mark as New
- Bookmark
- Subscribe
- Mute
- Subscribe to RSS Feed
- Permalink
- Report Inappropriate Content
Insert Legend in QlikView Chart and retain the stock tag / Insertar Leyenda en Gráfico Qlikview y conservar la etiqueta de valores
Good afternoon,
I am with a pie chart that distributes the weight that each country has in the turnover of a Multinational. I want to integrate the legend next to the guys to reduce spaces and improve the presentation but I also want to keep the distribution of the pie percentage (Which is achieved by clicking on relative in the properties chart.) Can anyone give me a hand?
I have been able to enter my legend in the data label, using the DUAL function but I can not make the percentages appear. Thank you.
Initial Situation:
Step 1: using Dual function
- - -
Buenas tardes,
Estoy con un gráfico de tarta que distribuye el peso que tiene cada País en la cifra de negocios de una Multinacional. Quiero integrar la leyenda al lado de los gajos para reducir espacios y mejorar la presentación pero también quiero conservar porcentualmente la distribución de la tarta (Que se consigue pinchando sobre relativo en el cuadro de propiedas. Alguien puede echarme una mano?
He conseguido introducir mi leyenda en la etiqueta de datos, utilizando la función DUAL pero no consigo hacer aparecer los porcentuales. Gracias.
Situación Inicial:
Paso 1: Step 1: using Dual function
Note: Edited by community moderator to include English translation first.
Accepted Solutions
- Mark as New
- Bookmark
- Subscribe
- Mute
- Subscribe to RSS Feed
- Permalink
- Report Inappropriate Content
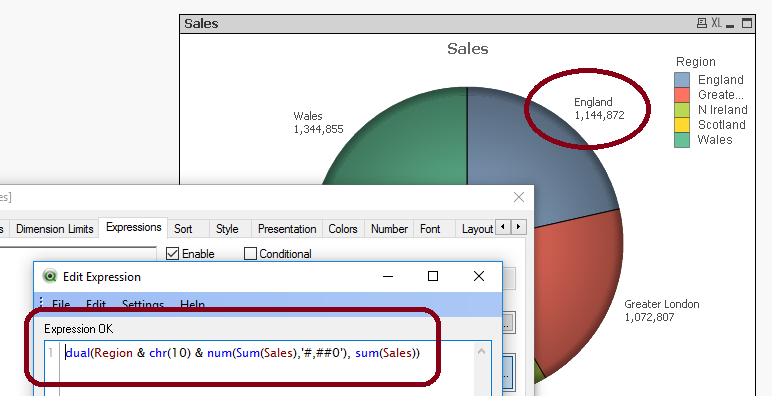
You really shouldn't use a pie chart here, never mind an exploded pie chart. A bar chart with horizontal bars will be much easier to read and will need a lot less space.
But you probably don't care. So try the dual function:

talk is cheap, supply exceeds demand
- Mark as New
- Bookmark
- Subscribe
- Mute
- Subscribe to RSS Feed
- Permalink
- Report Inappropriate Content
You really shouldn't use a pie chart here, never mind an exploded pie chart. A bar chart with horizontal bars will be much easier to read and will need a lot less space.
But you probably don't care. So try the dual function:

talk is cheap, supply exceeds demand
- Mark as New
- Bookmark
- Subscribe
- Mute
- Subscribe to RSS Feed
- Permalink
- Report Inappropriate Content
Great! I have done!! Thanks and regards.