Unlock a world of possibilities! Login now and discover the exclusive benefits awaiting you.
- Qlik Community
- :
- All Forums
- :
- QlikView App Dev
- :
- Re: Is it possable to not show value if the same a...
- Subscribe to RSS Feed
- Mark Topic as New
- Mark Topic as Read
- Float this Topic for Current User
- Bookmark
- Subscribe
- Mute
- Printer Friendly Page
- Mark as New
- Bookmark
- Subscribe
- Mute
- Subscribe to RSS Feed
- Permalink
- Report Inappropriate Content
Is it possable to not show value if the same as the line above in table
Hi
I have a report that I’m trying to create that will simply be exported to
excel, the data is correct and exports fine but I have been asked if it cannot
display the line if it is the same as the one above and just show the detail on
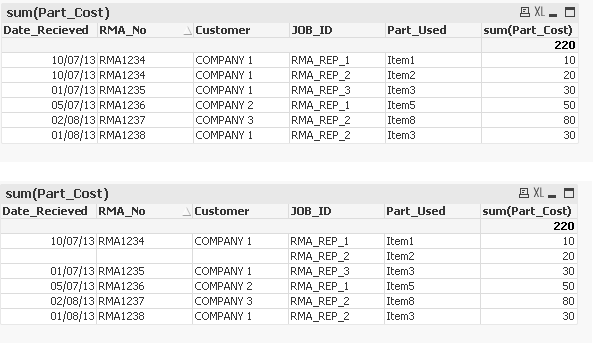
the line. (It’s kind of hard to explain, see the picture below)
The top image is what I have and the bottom image is what they want.
Thanks in advance experts!

- Mark as New
- Bookmark
- Subscribe
- Mute
- Subscribe to RSS Feed
- Permalink
- Report Inappropriate Content
Well, the first thing that comes to mind is to convert the chart from a Straight Table to a Pivot Table and that would ensure the proper grouping of the identical values.
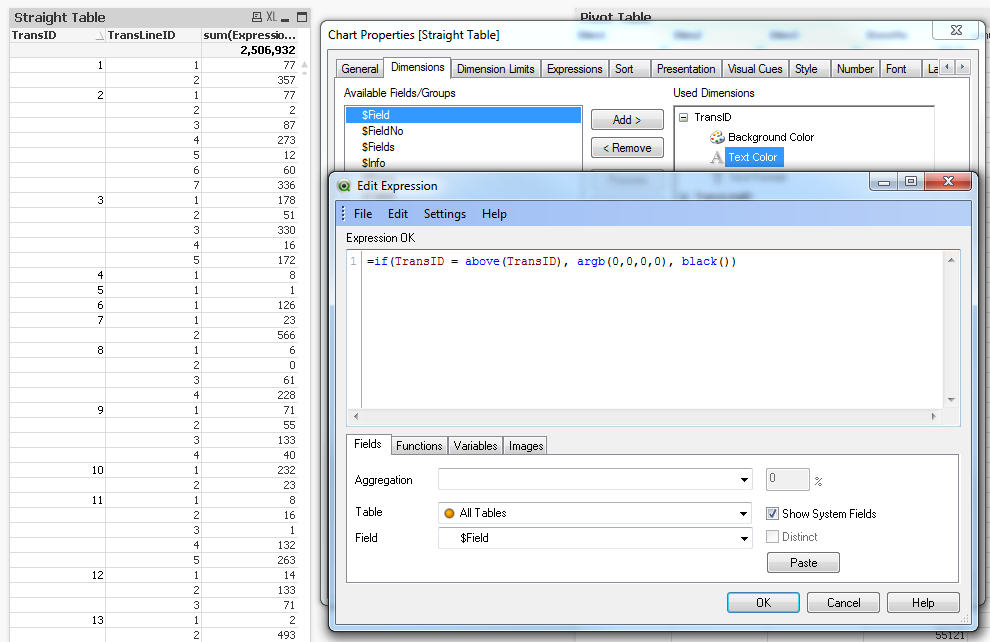
If, however, you want to say with the Straight Table, I'd suggest to play with the Text Color attribute of the dimension. Try using finctions like ABOVE() to compare the current value with the previous value. When the values are identical, set the Text Color to transparent - ARGB(0,0,0,0).
cheers,
Oleg Troyansky
- Mark as New
- Bookmark
- Subscribe
- Mute
- Subscribe to RSS Feed
- Permalink
- Report Inappropriate Content
Have you tried a pivot table?
- Mark as New
- Bookmark
- Subscribe
- Mute
- Subscribe to RSS Feed
- Permalink
- Report Inappropriate Content
If i change it to a pivot it displays correctly in qlikview but when you export to excel it creates the same as the straight table.
I have never used the Above function before so will do some more reading on that as my first try didn't work.
=if(RMA_No = Above(RMA_No),ARGB(0,0,0,0),rgb(0,0,0))
- Mark as New
- Bookmark
- Subscribe
- Mute
- Subscribe to RSS Feed
- Permalink
- Report Inappropriate Content
Works perfectly for me:

- Mark as New
- Bookmark
- Subscribe
- Mute
- Subscribe to RSS Feed
- Permalink
- Report Inappropriate Content
Try
=if(RMA_No = Above(TOTAL RMA_No),ARGB(0,0,0,0),rgb(0,0,0))