Unlock a world of possibilities! Login now and discover the exclusive benefits awaiting you.
- Qlik Community
- :
- All Forums
- :
- QlikView App Dev
- :
- Is it possible in Lince Chart/Comb Chart to filter...
- Subscribe to RSS Feed
- Mark Topic as New
- Mark Topic as Read
- Float this Topic for Current User
- Bookmark
- Subscribe
- Mute
- Printer Friendly Page
- Mark as New
- Bookmark
- Subscribe
- Mute
- Subscribe to RSS Feed
- Permalink
- Report Inappropriate Content
Is it possible in Lince Chart/Comb Chart to filter the scale of the graphs
Dear Team,
One of my client is looking for an option to filter/select the scale of the graph
for example-> – i.e. If certain KPI holds values 0-100%, but the user wants to focus only on the 0-10% values from the graph.
Is it realay possible to filter/select the scale (Yaxes) used with expression ->and graph will change accordingly?
I guess only dimension values can be selected in agraph and graph will change but selecting on the graph scale ,is it possible?
Please guide.
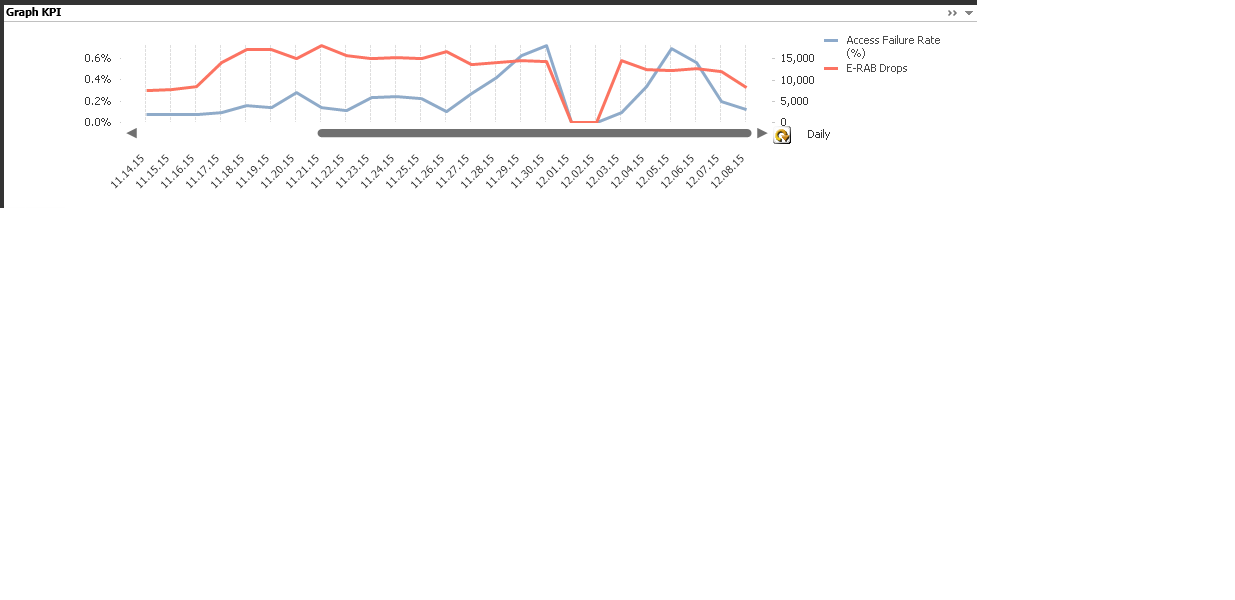
Attached is the sampel graph like :
Here fi you see there are multiple KPi 's selected and graph axes shows values .
If user selects on values say(2000-2500) can the graph be shown based on the Kpi values between (2000-2500).
Your help is required if there is way out.
- Mark as New
- Bookmark
- Subscribe
- Mute
- Subscribe to RSS Feed
- Permalink
- Report Inappropriate Content
Yes,
Its possible .Can u share some sample data? that related to your requirement.
-Nagarjuna
- Mark as New
- Bookmark
- Subscribe
- Mute
- Subscribe to RSS Feed
- Permalink
- Report Inappropriate Content
Dear Nagarjuna,
Would it be possible for you to have a webex discussion show that I can show the dashboard data over there?
- Mark as New
- Bookmark
- Subscribe
- Mute
- Subscribe to RSS Feed
- Permalink
- Report Inappropriate Content
Avinash Jain 14 Jan, 2016 4:47 AM (in response to nagarjuna.kothamandi)
Dear Nagarjuna,
Would it be possible for you to have a webex discussion show that I can show the dashboard data over there?
- Mark as New
- Bookmark
- Subscribe
- Mute
- Subscribe to RSS Feed
- Permalink
- Report Inappropriate Content
Would it be possible for you to have a webex discussion show that I can show the dashboard data over there?