Unlock a world of possibilities! Login now and discover the exclusive benefits awaiting you.
- Qlik Community
- :
- All Forums
- :
- QlikView App Dev
- :
- Re: Is it possible to combine two combo charts as ...
- Subscribe to RSS Feed
- Mark Topic as New
- Mark Topic as Read
- Float this Topic for Current User
- Bookmark
- Subscribe
- Mute
- Printer Friendly Page
- Mark as New
- Bookmark
- Subscribe
- Mute
- Subscribe to RSS Feed
- Permalink
- Report Inappropriate Content
Is it possible to combine two combo charts as one?
Hi,
I have two combo chart items.
Chart A:
Dimension: =IF(FiscalWeekSerial>=$(curFiscalWeekSeq)-4,Dateinsert)
Expression: Count(DISTINCT {$<DateType={'EnterDate'},FromGent={'0'},Flag={2}>} ID)
ChartB:
Dimension: =IF(FiscalWeekSerial>=$(curFiscalWeekSeq)-4,FiscalWeek)
Expression: Count(DISTINCT {$<DateType={'EnterDate'},FromGent={'0'},Flag={2}>} ID)
so, the chart A shows Dates on horizotal axis and count of IDs on vertical axis. Chart B shows weeks on horizotal axis and count of IDs on vertical axis.
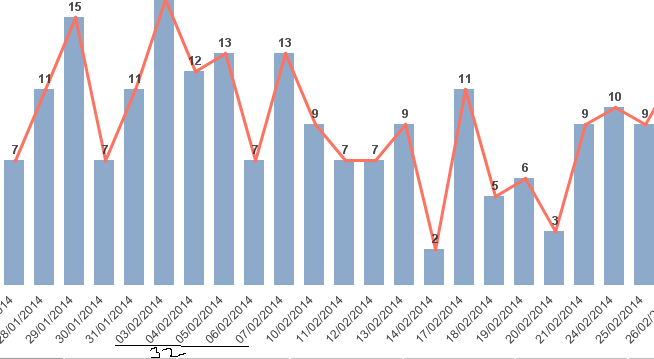
Now I need to combine the two charts so that the horizontal axis need to show both Weeks and Dates. I,e from 03/02/2014 to 07/02/2014 it should show with week 32.
Is this possible please can anyone let me know.
Thanks.
- Tags:
- new_to_qlikview
- « Previous Replies
- Next Replies »
Accepted Solutions
- Mark as New
- Bookmark
- Subscribe
- Mute
- Subscribe to RSS Feed
- Permalink
- Report Inappropriate Content
Crate a Bar Char with
Dimension1: =IF(FiscalWeekSerial>=$(curFiscalWeekSeq)-4,Dateinsert)
Dimension2: =IF(FiscalWeekSerial>=$(curFiscalWeekSeq)-4,FiscalWeek)
Expression1: Count(DISTINCT {$<DateType={'EnterDate'},FromGent={'0'},Flag={2}>} ID)
Expression2: 0
Open the properties and go to the Presentation tab. Deselect the Show Legend option
Hope this helps....
Update : Please Promote and Demote your first and second dimensions according to your requirements
SOURCE : QlikView for Developers COOKBOOK by Barry Harmsen.
- Mark as New
- Bookmark
- Subscribe
- Mute
- Subscribe to RSS Feed
- Permalink
- Report Inappropriate Content
Please find attached.
Edit: I need to show whihc is in attached Need to show.png
- Mark as New
- Bookmark
- Subscribe
- Mute
- Subscribe to RSS Feed
- Permalink
- Report Inappropriate Content
You can create a cyclic group for your both dimensions and use in a dimension.
- Mark as New
- Bookmark
- Subscribe
- Mute
- Subscribe to RSS Feed
- Permalink
- Report Inappropriate Content
Thanks for your prompt reply, and I used cyclic group. But my user need to click on every time right to see week and Dateinsert. I want to have both in horizontal axis. with out my user clicking one by one. Is it possible please let me know.
- Mark as New
- Bookmark
- Subscribe
- Mute
- Subscribe to RSS Feed
- Permalink
- Report Inappropriate Content
Crate a Bar Char with
Dimension1: =IF(FiscalWeekSerial>=$(curFiscalWeekSeq)-4,Dateinsert)
Dimension2: =IF(FiscalWeekSerial>=$(curFiscalWeekSeq)-4,FiscalWeek)
Expression1: Count(DISTINCT {$<DateType={'EnterDate'},FromGent={'0'},Flag={2}>} ID)
Expression2: 0
Open the properties and go to the Presentation tab. Deselect the Show Legend option
Hope this helps....
Update : Please Promote and Demote your first and second dimensions according to your requirements
SOURCE : QlikView for Developers COOKBOOK by Barry Harmsen.
- Mark as New
- Bookmark
- Subscribe
- Mute
- Subscribe to RSS Feed
- Permalink
- Report Inappropriate Content
Thanks and it is showing for each week different bar colours. Is there any way to display under(below) 03/02/2014 to 07/02/2014 as 32?
EDIT: as attached
- Mark as New
- Bookmark
- Subscribe
- Mute
- Subscribe to RSS Feed
- Permalink
- Report Inappropriate Content
Further any change to display under(below) 03/02/2014 to 07/02/2014 as 32?
- Mark as New
- Bookmark
- Subscribe
- Mute
- Subscribe to RSS Feed
- Permalink
- Report Inappropriate Content
Didn't understand... Please upload your sample file... or proper screen shot.
- Mark as New
- Bookmark
- Subscribe
- Mute
- Subscribe to RSS Feed
- Permalink
- Report Inappropriate Content
Sorry. what I mean is, is there any other chance with out doing promote or demoting the dimensions?
- Mark as New
- Bookmark
- Subscribe
- Mute
- Subscribe to RSS Feed
- Permalink
- Report Inappropriate Content
You can take Week as first dimension and Date as Second...
- « Previous Replies
- Next Replies »