Unlock a world of possibilities! Login now and discover the exclusive benefits awaiting you.
- Qlik Community
- :
- All Forums
- :
- QlikView App Dev
- :
- Re: Is it possible to show by year,product growth ...
- Subscribe to RSS Feed
- Mark Topic as New
- Mark Topic as Read
- Float this Topic for Current User
- Bookmark
- Subscribe
- Mute
- Printer Friendly Page
- Mark as New
- Bookmark
- Subscribe
- Mute
- Subscribe to RSS Feed
- Permalink
- Report Inappropriate Content
Is it possible to show by year,product growth rate and year growth in one line chart?
Hi All,
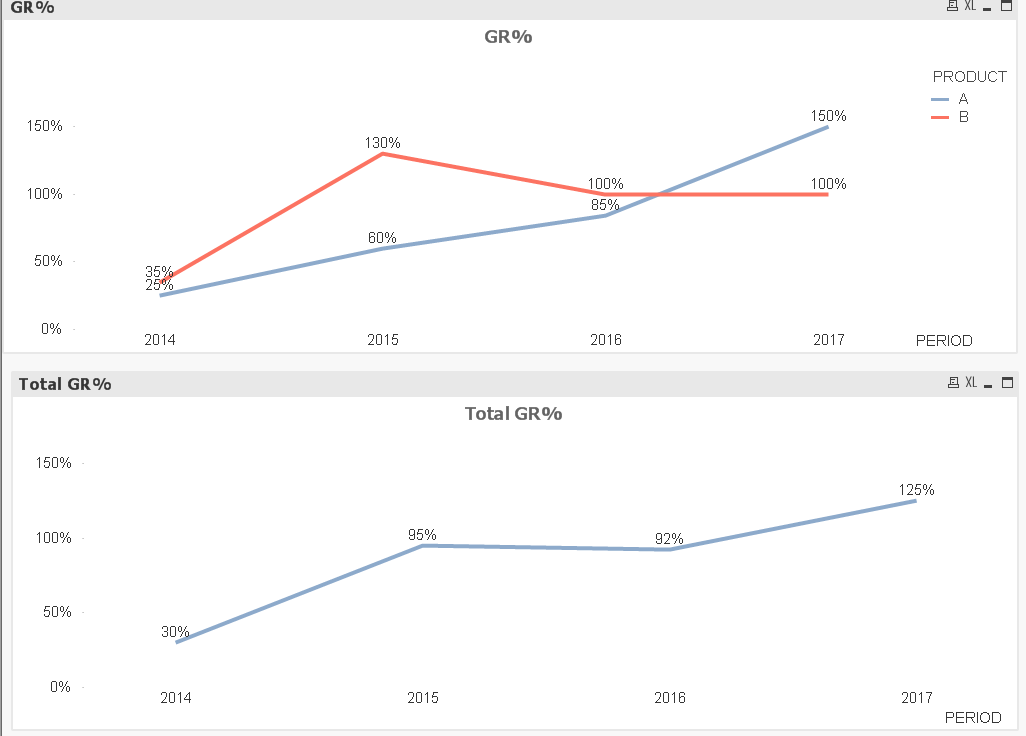
Is it possible to show the growth rate by year, product growth rate and total year growth rate in one line chart in expression directly?

I know we could add rows in the source data like 'Total' in product.
Due to in some scenario it's not easy to change in the backend, I just ask the possibilities of this.
I've attached my QlikView file.
Thank you very much.
Best Regards.
Jia-wen.
Accepted Solutions
- Mark as New
- Bookmark
- Subscribe
- Mute
- Subscribe to RSS Feed
- Permalink
- Report Inappropriate Content
![2018-03-19 09_43_19-QlikView x64 - [C__Users_Stefan_Downloads_GrowthRateShowing.qvw].png](/legacyfs/online/196692_2018-03-19 09_43_19-QlikView x64 - [C__Users_Stefan_Downloads_GrowthRateShowing.qvw].png)
Maybe like attached, using an island table to create a dimension to branch into Product and TOTAL.
- Mark as New
- Bookmark
- Subscribe
- Mute
- Subscribe to RSS Feed
- Permalink
- Report Inappropriate Content
You can do it my writing one expression each for each product.
Dimension: Year:
exp1: sum({<Product={'A'}>} Sale/SUM(LY_VALUE) - 1
exp2: sum({<Product={'B'}>} Sale/SUM(LY_VALUE) - 1
Exp3: sum(Sale)/SUM(LY_VALUE) - 1
Br,
KC
KC
- Mark as New
- Bookmark
- Subscribe
- Mute
- Subscribe to RSS Feed
- Permalink
- Report Inappropriate Content
Or enable the Total option on dimension limits tab in your original upper left chart:
![2018-03-19 09_48_03-Chart Properties [GR%].png](/legacyfs/online/196693_2018-03-19 09_48_03-Chart Properties [GR%].png)
- Mark as New
- Bookmark
- Subscribe
- Mute
- Subscribe to RSS Feed
- Permalink
- Report Inappropriate Content
May be this?
- Mark as New
- Bookmark
- Subscribe
- Mute
- Subscribe to RSS Feed
- Permalink
- Report Inappropriate Content
Hi Stefan,
Really nice way , learned a lot!
Though this way change the backend structure but it do have no impact on the other expressions in the front end.
Thank you very much.
Best Regards.
Jia-wen.
- Mark as New
- Bookmark
- Subscribe
- Mute
- Subscribe to RSS Feed
- Permalink
- Report Inappropriate Content
Thanks KC for your time. In the project senario, the product is dynamicly caculated.
- Mark as New
- Bookmark
- Subscribe
- Mute
- Subscribe to RSS Feed
- Permalink
- Report Inappropriate Content
This is also a good way.Thanks but the island table would be a better solution when the product is dynamicly calulated.